00018198102025FYfalseimmaterialhttp://fasb.org/us-gaap/2025#OtherNonoperatingIncomeExpensehttp://fasb.org/us-gaap/2025#OtherNonoperatingIncomeExpensehttp://fasb.org/us-gaap/2025#AssetImpairmentChargeshttp://fasb.org/us-gaap/2025#AssetImpairmentChargeshttp://fasb.org/us-gaap/2025#PropertyPlantAndEquipmentAndFinanceLeaseRightOfUseAssetAfterAccumulatedDepreciationAndAmortizationhttp://fasb.org/us-gaap/2025#PropertyPlantAndEquipmentAndFinanceLeaseRightOfUseAssetAfterAccumulatedDepreciationAndAmortizationP1YP5Miso4217:USDxbrli:sharesiso4217:USDxbrli:sharesrdw:segmentrdw:reportingUnitxbrli:purerdw:Yearrdw:leaserdw:voterdw:planrdw:period00018198102025-01-012025-12-3100018198102025-06-3000018198102026-02-2300018198102025-12-3100018198102024-12-3100018198102024-01-012024-12-3100018198102023-01-012023-12-310001819810us-gaap:CommonStockMember2022-12-310001819810us-gaap:TreasuryStockCommonMember2022-12-310001819810us-gaap:AdditionalPaidInCapitalMember2022-12-310001819810us-gaap:RetainedEarningsMember2022-12-310001819810us-gaap:AccumulatedOtherComprehensiveIncomeMember2022-12-310001819810us-gaap:ParentMember2022-12-310001819810us-gaap:NoncontrollingInterestMember2022-12-3100018198102022-12-310001819810us-gaap:AdditionalPaidInCapitalMember2023-01-012023-12-310001819810us-gaap:ParentMember2023-01-012023-12-310001819810us-gaap:CommonStockMember2023-01-012023-12-310001819810us-gaap:TreasuryStockCommonMember2023-01-012023-12-310001819810us-gaap:AccumulatedOtherComprehensiveIncomeMember2023-01-012023-12-310001819810us-gaap:NoncontrollingInterestMember2023-01-012023-12-310001819810us-gaap:RetainedEarningsMember2023-01-012023-12-310001819810us-gaap:CommonStockMember2023-12-310001819810us-gaap:TreasuryStockCommonMember2023-12-310001819810us-gaap:AdditionalPaidInCapitalMember2023-12-310001819810us-gaap:RetainedEarningsMember2023-12-310001819810us-gaap:AccumulatedOtherComprehensiveIncomeMember2023-12-310001819810us-gaap:ParentMember2023-12-310001819810us-gaap:NoncontrollingInterestMember2023-12-3100018198102023-12-310001819810us-gaap:AdditionalPaidInCapitalMember2024-01-012024-12-310001819810us-gaap:ParentMember2024-01-012024-12-310001819810us-gaap:CommonStockMember2024-01-012024-12-310001819810us-gaap:TreasuryStockCommonMember2024-01-012024-12-310001819810us-gaap:AccumulatedOtherComprehensiveIncomeMember2024-01-012024-12-310001819810us-gaap:NoncontrollingInterestMember2024-01-012024-12-310001819810us-gaap:RetainedEarningsMember2024-01-012024-12-310001819810us-gaap:CommonStockMember2024-12-310001819810us-gaap:TreasuryStockCommonMember2024-12-310001819810us-gaap:AdditionalPaidInCapitalMember2024-12-310001819810us-gaap:RetainedEarningsMember2024-12-310001819810us-gaap:AccumulatedOtherComprehensiveIncomeMember2024-12-310001819810us-gaap:ParentMember2024-12-310001819810us-gaap:NoncontrollingInterestMember2024-12-310001819810us-gaap:AdditionalPaidInCapitalMember2025-01-012025-12-310001819810us-gaap:ParentMember2025-01-012025-12-310001819810rdw:EquityOfferingMemberus-gaap:CommonStockMember2025-01-012025-12-310001819810rdw:EquityOfferingMemberus-gaap:AdditionalPaidInCapitalMember2025-01-012025-12-310001819810rdw:EquityOfferingMemberus-gaap:ParentMember2025-01-012025-12-310001819810rdw:EquityOfferingMember2025-01-012025-12-310001819810us-gaap:CommonStockMember2025-01-012025-12-310001819810rdw:ATMAgreementMemberus-gaap:CommonStockMember2025-01-012025-12-310001819810rdw:ATMAgreementMemberus-gaap:AdditionalPaidInCapitalMember2025-01-012025-12-310001819810rdw:ATMAgreementMemberus-gaap:ParentMember2025-01-012025-12-310001819810rdw:ATMAgreementMember2025-01-012025-12-310001819810us-gaap:TreasuryStockCommonMember2025-01-012025-12-310001819810us-gaap:RetainedEarningsMember2025-01-012025-12-310001819810us-gaap:AccumulatedOtherComprehensiveIncomeMember2025-01-012025-12-310001819810us-gaap:CommonStockMember2025-12-310001819810us-gaap:TreasuryStockCommonMember2025-12-310001819810us-gaap:AdditionalPaidInCapitalMember2025-12-310001819810us-gaap:RetainedEarningsMember2025-12-310001819810us-gaap:AccumulatedOtherComprehensiveIncomeMember2025-12-310001819810us-gaap:ParentMember2025-12-310001819810us-gaap:NoncontrollingInterestMember2025-12-310001819810us-gaap:ComputerEquipmentMember2025-12-310001819810us-gaap:FurnitureAndFixturesMember2025-12-310001819810srt:MinimumMemberus-gaap:EquipmentMember2025-12-310001819810srt:MaximumMemberus-gaap:EquipmentMember2025-12-310001819810srt:MinimumMemberus-gaap:VehiclesMember2025-12-310001819810srt:MaximumMemberus-gaap:VehiclesMember2025-12-310001819810us-gaap:LeaseholdImprovementsMember2025-12-310001819810us-gaap:EmployeeStockMember2025-01-012025-12-310001819810rdw:EdgeAutonomyIntermediateHoldingsLLCMember2025-01-200001819810rdw:EdgeAutonomyIntermediateHoldingsLLCMember2025-06-132025-06-130001819810rdw:EdgeAutonomyIntermediateHoldingsLLCMember2025-06-130001819810rdw:EdgeAutonomyIntermediateHoldingsLLCMemberus-gaap:CustomerRelationshipsMember2025-06-130001819810rdw:EdgeAutonomyIntermediateHoldingsLLCMemberus-gaap:CustomerRelationshipsMember2025-06-132025-06-130001819810rdw:EdgeAutonomyIntermediateHoldingsLLCMemberus-gaap:DevelopedTechnologyRightsMember2025-06-130001819810rdw:EdgeAutonomyIntermediateHoldingsLLCMemberus-gaap:DevelopedTechnologyRightsMember2025-06-132025-06-130001819810rdw:EdgeAutonomyIntermediateHoldingsLLCMemberus-gaap:CustomerRelatedIntangibleAssetsMember2025-06-130001819810rdw:EdgeAutonomyIntermediateHoldingsLLCMemberus-gaap:CustomerRelatedIntangibleAssetsMember2025-06-132025-06-130001819810rdw:EdgeAutonomyIntermediateHoldingsLLCMember2025-01-012025-12-310001819810rdw:BusinessCombinations2022Member2025-01-012025-12-310001819810rdw:BusinessCombinations2022Member2024-01-012024-12-310001819810rdw:HeraSystemsInc.Member2024-08-300001819810rdw:HeraSystemsInc.Member2025-01-012025-12-310001819810rdw:HeraSystemsInc.Member2024-01-012024-12-310001819810rdw:EdgeAutonomyIntermediateHoldingsLLCMembersrt:RevisionOfPriorPeriodReclassificationAdjustmentMember2025-10-012025-12-310001819810rdw:PrivateWarrantsMember2021-09-300001819810rdw:PrivateWarrantsMember2025-01-012025-12-310001819810rdw:PrivateWarrantsMember2024-01-012024-12-310001819810rdw:PrivateWarrantsMemberus-gaap:CommonStockMember2025-01-012025-12-3100018198102025-02-250001819810us-gaap:MeasurementInputExercisePriceMember2025-12-310001819810us-gaap:MeasurementInputExercisePriceMember2025-02-250001819810us-gaap:MeasurementInputExercisePriceMember2024-12-310001819810us-gaap:MeasurementInputSharePriceMember2025-12-310001819810us-gaap:MeasurementInputSharePriceMember2025-02-250001819810us-gaap:MeasurementInputSharePriceMember2024-12-310001819810us-gaap:MeasurementInputExpectedTermMember2025-12-310001819810us-gaap:MeasurementInputExpectedTermMember2025-02-250001819810us-gaap:MeasurementInputExpectedTermMember2024-12-310001819810us-gaap:MeasurementInputOptionVolatilityMember2025-12-310001819810us-gaap:MeasurementInputOptionVolatilityMember2025-02-250001819810us-gaap:MeasurementInputOptionVolatilityMember2024-12-310001819810us-gaap:MeasurementInputRiskFreeInterestRateMember2025-12-310001819810us-gaap:MeasurementInputRiskFreeInterestRateMember2025-02-250001819810us-gaap:MeasurementInputRiskFreeInterestRateMember2024-12-310001819810us-gaap:MeasurementInputExpectedDividendRateMember2025-12-310001819810us-gaap:MeasurementInputExpectedDividendRateMember2025-02-250001819810us-gaap:MeasurementInputExpectedDividendRateMember2024-12-310001819810us-gaap:FairValueInputsLevel1Member2025-12-310001819810us-gaap:FairValueInputsLevel2Member2025-12-310001819810us-gaap:FairValueInputsLevel3Member2025-12-310001819810us-gaap:FairValueInputsLevel1Member2024-12-310001819810us-gaap:FairValueInputsLevel2Member2024-12-310001819810us-gaap:FairValueInputsLevel3Member2024-12-310001819810rdw:PrivateWarrantsMember2023-12-310001819810rdw:PrivateWarrantsMember2024-12-310001819810rdw:PrivateWarrantsMember2025-12-310001819810country:USus-gaap:ComputerEquipmentMember2025-12-310001819810srt:EuropeMemberus-gaap:ComputerEquipmentMember2025-12-310001819810country:USus-gaap:ComputerEquipmentMember2024-12-310001819810srt:EuropeMemberus-gaap:ComputerEquipmentMember2024-12-310001819810us-gaap:ComputerEquipmentMember2024-12-310001819810country:USus-gaap:FurnitureAndFixturesMember2025-12-310001819810srt:EuropeMemberus-gaap:FurnitureAndFixturesMember2025-12-310001819810country:USus-gaap:FurnitureAndFixturesMember2024-12-310001819810srt:EuropeMemberus-gaap:FurnitureAndFixturesMember2024-12-310001819810us-gaap:FurnitureAndFixturesMember2024-12-310001819810country:USus-gaap:EquipmentMember2025-12-310001819810srt:EuropeMemberus-gaap:EquipmentMember2025-12-310001819810us-gaap:EquipmentMember2025-12-310001819810country:USus-gaap:EquipmentMember2024-12-310001819810srt:EuropeMemberus-gaap:EquipmentMember2024-12-310001819810us-gaap:EquipmentMember2024-12-310001819810country:USus-gaap:LeaseholdImprovementsMember2025-12-310001819810srt:EuropeMemberus-gaap:LeaseholdImprovementsMember2025-12-310001819810country:USus-gaap:LeaseholdImprovementsMember2024-12-310001819810srt:EuropeMemberus-gaap:LeaseholdImprovementsMember2024-12-310001819810us-gaap:LeaseholdImprovementsMember2024-12-310001819810country:USus-gaap:VehiclesMember2025-12-310001819810srt:EuropeMemberus-gaap:VehiclesMember2025-12-310001819810us-gaap:VehiclesMember2025-12-310001819810country:USus-gaap:VehiclesMember2024-12-310001819810srt:EuropeMemberus-gaap:VehiclesMember2024-12-310001819810us-gaap:VehiclesMember2024-12-310001819810country:US2025-12-310001819810srt:EuropeMember2025-12-310001819810country:US2024-12-310001819810srt:EuropeMember2024-12-310001819810country:USus-gaap:ConstructionInProgressMember2025-12-310001819810srt:EuropeMemberus-gaap:ConstructionInProgressMember2025-12-310001819810us-gaap:ConstructionInProgressMember2025-12-310001819810country:USus-gaap:ConstructionInProgressMember2024-12-310001819810srt:EuropeMemberus-gaap:ConstructionInProgressMember2024-12-310001819810us-gaap:ConstructionInProgressMember2024-12-310001819810us-gaap:CustomerRelationshipsMember2025-12-310001819810us-gaap:TechnologyBasedIntangibleAssetsMember2025-12-310001819810us-gaap:TrademarksMember2025-12-310001819810us-gaap:LicensingAgreementsMember2025-12-310001819810us-gaap:ComputerSoftwareIntangibleAssetMember2025-12-310001819810us-gaap:TradeNamesMember2025-12-310001819810us-gaap:CustomerRelationshipsMember2024-12-310001819810us-gaap:TechnologyBasedIntangibleAssetsMember2024-12-310001819810us-gaap:TrademarksMember2024-12-310001819810us-gaap:LicensingAgreementsMember2024-12-310001819810us-gaap:ComputerSoftwareIntangibleAssetMember2024-12-310001819810us-gaap:TradeNamesMember2024-12-310001819810rdw:SpaceSegmentMember2023-12-310001819810rdw:DefenseTechSegmentMember2023-12-310001819810rdw:SpaceSegmentMember2024-01-012024-12-310001819810rdw:DefenseTechSegmentMember2024-01-012024-12-310001819810rdw:SpaceSegmentMember2024-12-310001819810rdw:DefenseTechSegmentMember2024-12-310001819810rdw:SpaceSegmentMember2025-01-012025-12-310001819810rdw:DefenseTechSegmentMember2025-01-012025-12-310001819810rdw:SpaceSegmentMember2025-12-310001819810rdw:DefenseTechSegmentMember2025-12-310001819810rdw:SpaceMember2025-01-012025-12-310001819810rdw:SpaceMember2025-12-310001819810rdw:AdamsStreetCapitalAgreementMemberus-gaap:MediumTermNotesMember2025-12-310001819810rdw:AdamsStreetCapitalAgreementMemberus-gaap:MediumTermNotesMember2024-12-310001819810rdw:AdamsStreetCapitalAgreementDelayedDrawTermLoanMemberus-gaap:MediumTermNotesMember2025-12-310001819810rdw:AdamsStreetCapitalAgreementDelayedDrawTermLoanMemberus-gaap:MediumTermNotesMember2024-12-310001819810rdw:AdamsStreetCapitalAgreementIncrementalTermLoanMemberus-gaap:MediumTermNotesMember2025-12-310001819810rdw:AdamsStreetCapitalAgreementIncrementalTermLoanMemberus-gaap:MediumTermNotesMember2024-12-310001819810us-gaap:RevolvingCreditFacilityMemberrdw:AdamsStreetCapitalAgreementMemberus-gaap:LineOfCreditMember2025-12-310001819810us-gaap:RevolvingCreditFacilityMemberrdw:AdamsStreetCapitalAgreementMemberus-gaap:LineOfCreditMember2024-12-310001819810us-gaap:RevolvingCreditFacilityMemberrdw:JPMorganTermLoanMemberus-gaap:LineOfCreditMember2025-12-310001819810us-gaap:RevolvingCreditFacilityMemberrdw:JPMorganTermLoanMemberus-gaap:LineOfCreditMember2024-12-310001819810rdw:OtherFinancingLoansMemberus-gaap:NotesPayableToBanksMember2025-12-310001819810rdw:OtherFinancingLoansMemberus-gaap:NotesPayableToBanksMember2024-12-310001819810us-gaap:RevolvingCreditFacilityMemberrdw:AdamsStreetCapitalAgreementMemberus-gaap:LineOfCreditMember2025-01-012025-12-310001819810us-gaap:RevolvingCreditFacilityMemberus-gaap:SecuredOvernightFinancingRateSofrMemberrdw:AdamsStreetCapitalAgreementMemberus-gaap:LineOfCreditMember2025-01-012025-12-310001819810us-gaap:RevolvingCreditFacilityMemberus-gaap:BaseRateMemberrdw:AdamsStreetCapitalAgreementMemberus-gaap:LineOfCreditMember2025-01-012025-12-310001819810us-gaap:RevolvingCreditFacilityMemberus-gaap:SecuredOvernightFinancingRateSofrMemberrdw:AdamsStreetCapitalAgreementMemberrdw:VariableRateComponentOneMemberus-gaap:LineOfCreditMember2025-01-012025-12-310001819810us-gaap:RevolvingCreditFacilityMemberus-gaap:BaseRateMemberrdw:AdamsStreetCapitalAgreementMemberrdw:VariableRateComponentOneMemberus-gaap:LineOfCreditMember2025-01-012025-12-310001819810us-gaap:RevolvingCreditFacilityMemberus-gaap:SecuredOvernightFinancingRateSofrMemberrdw:AdamsStreetCapitalAgreementMemberrdw:VariableRateComponentTwoMemberus-gaap:LineOfCreditMember2025-01-012025-12-310001819810us-gaap:RevolvingCreditFacilityMemberus-gaap:BaseRateMemberrdw:AdamsStreetCapitalAgreementMemberrdw:VariableRateComponentTwoMemberus-gaap:LineOfCreditMember2025-01-012025-12-310001819810us-gaap:RevolvingCreditFacilityMemberrdw:AdamsStreetCapitalAgreementMemberus-gaap:LineOfCreditMember2022-03-310001819810us-gaap:RevolvingCreditFacilityMemberrdw:AdamsStreetCapitalAgreementMembersrt:MaximumMemberus-gaap:LineOfCreditMember2022-03-310001819810us-gaap:RevolvingCreditFacilityMemberrdw:AdamsStreetCapitalAgreementMemberus-gaap:LineOfCreditMember2022-03-012022-03-310001819810us-gaap:RevolvingCreditFacilityMemberrdw:AdamsStreetCapitalAgreementMemberus-gaap:LineOfCreditMember2023-12-310001819810us-gaap:RevolvingCreditFacilityMemberrdw:AdamsStreetCapitalAgreementMemberus-gaap:LineOfCreditMember2024-06-300001819810us-gaap:RevolvingCreditFacilityMemberrdw:AdamsStreetCapitalAgreementMemberus-gaap:LineOfCreditMember2024-06-302024-06-300001819810us-gaap:RevolvingCreditFacilityMemberrdw:AdamsStreetCapitalAgreementMemberus-gaap:LineOfCreditMember2024-08-310001819810us-gaap:RevolvingCreditFacilityMemberrdw:AdamsStreetCapitalAgreementMemberus-gaap:LineOfCreditMember2024-08-312024-08-310001819810rdw:AdamsStreetCapitalAgreementMemberus-gaap:MediumTermNotesMember2025-12-312025-12-310001819810us-gaap:RevolvingCreditFacilityMemberrdw:AdamsStreetCapitalAgreementMemberus-gaap:LineOfCreditMember2025-12-312025-12-310001819810rdw:JPMorganChaseCreditAgreementMemberrdw:EdgeIntermediateHoldingsLLCMemberus-gaap:MediumTermNotesMember2025-06-300001819810rdw:PerAnnumRateThroughDecember312025Memberrdw:JPMorganChaseCreditAgreementMemberrdw:EdgeIntermediateHoldingsLLCMemberus-gaap:MediumTermNotesMember2025-06-012025-06-300001819810rdw:PerAnnumRateFromJanuary12026ThroughMaturityMemberrdw:JPMorganChaseCreditAgreementMemberrdw:EdgeIntermediateHoldingsLLCMemberus-gaap:MediumTermNotesMember2025-06-012025-06-300001819810rdw:JPMorganChaseCreditAgreementMemberrdw:EdgeIntermediateHoldingsLLCMemberus-gaap:MediumTermNotesMember2025-06-012025-06-300001819810rdw:UltimateHoldingsMemberrdw:SellerNoteMemberus-gaap:NotesPayableOtherPayablesMember2025-06-012025-06-300001819810rdw:AnnualRateThroughDecember312025Memberrdw:UltimateHoldingsMemberrdw:SellerNoteMemberus-gaap:NotesPayableOtherPayablesMember2025-06-300001819810rdw:AnnualRateAfterDecember312025Memberrdw:UltimateHoldingsMemberrdw:SellerNoteMemberus-gaap:NotesPayableOtherPayablesMember2025-06-012025-06-300001819810rdw:CommonStockTransactionsMember2025-06-012025-06-300001819810rdw:CommonStockTransactionsMember2025-06-300001819810rdw:EquityOfferingMember2025-06-012025-06-300001819810rdw:CommonStockTransactionsMember2025-01-012025-12-310001819810rdw:JPMorganTermLoanMemberus-gaap:NotesPayableToBanksMember2025-12-310001819810srt:MinimumMember2025-12-310001819810srt:MaximumMember2025-12-310001819810rdw:PublicWarrantsMember2025-12-310001819810rdw:PublicWarrantsMember2025-01-012025-12-310001819810rdw:PublicWarrantsMember2024-12-310001819810rdw:EquityOfferingMember2025-06-300001819810rdw:EquityOfferingMember2025-07-012025-07-310001819810rdw:EquityOfferingMember2025-07-310001819810rdw:ATMAgreementMember2025-11-300001819810rdw:ATMAgreementMember2025-11-012025-11-300001819810rdw:ATMAgreementMember2025-12-310001819810country:BE2025-01-012025-12-310001819810us-gaap:ForeignTaxJurisdictionOtherMember2025-01-012025-12-310001819810country:US2025-01-012025-12-310001819810us-gaap:DomesticCountryMember2025-12-310001819810us-gaap:StateAndLocalJurisdictionMember2025-12-310001819810us-gaap:ForeignCountryMember2025-12-310001819810rdw:YinglingV.CannitoEtAl.Member2025-08-142025-08-140001819810rdw:YinglingV.CannitoEtAl.Member2025-12-310001819810us-gaap:ConvertiblePreferredStockMember2022-10-2800018198102022-10-280001819810us-gaap:ConvertiblePreferredStockMember2022-10-282022-10-280001819810us-gaap:ConvertiblePreferredStockMember2023-10-310001819810us-gaap:PreferredClassAMember2025-05-012025-05-3100018198102025-11-012025-11-3000018198102025-04-152025-04-1500018198102025-10-152025-10-1500018198102025-05-012025-05-3100018198102025-05-3100018198102025-11-300001819810us-gaap:ConvertiblePreferredStockMember2025-01-012025-12-310001819810us-gaap:ConvertiblePreferredStockMemberrdw:BainInvestmentAgreementMember2022-11-030001819810us-gaap:ConvertiblePreferredStockMemberrdw:BainInvestmentAgreementMember2025-01-012025-12-310001819810us-gaap:ConvertiblePreferredStockMemberrdw:AEIAndBainInvestmentAgreementsMember2022-10-282022-10-280001819810us-gaap:ConvertiblePreferredStockMemberrdw:AEIAndBainInvestmentAgreementsMember2022-10-280001819810us-gaap:ConvertiblePreferredStockMember2023-06-2000018198102021-09-020001819810rdw:CivilSpaceMemberrdw:SpaceSegmentMember2025-01-012025-12-310001819810rdw:CivilSpaceMemberrdw:DefenseTechSegmentMember2025-01-012025-12-310001819810rdw:CivilSpaceMember2025-01-012025-12-310001819810rdw:NationalSecurityMemberrdw:SpaceSegmentMember2025-01-012025-12-310001819810rdw:NationalSecurityMemberrdw:DefenseTechSegmentMember2025-01-012025-12-310001819810rdw:NationalSecurityMember2025-01-012025-12-310001819810rdw:CommercialAndOtherMemberrdw:SpaceSegmentMember2025-01-012025-12-310001819810rdw:CommercialAndOtherMemberrdw:DefenseTechSegmentMember2025-01-012025-12-310001819810rdw:CommercialAndOtherMember2025-01-012025-12-310001819810country:USrdw:SpaceSegmentMember2025-01-012025-12-310001819810country:USrdw:DefenseTechSegmentMember2025-01-012025-12-310001819810country:US2025-01-012025-12-310001819810srt:EuropeMemberrdw:SpaceSegmentMember2025-01-012025-12-310001819810srt:EuropeMemberrdw:DefenseTechSegmentMember2025-01-012025-12-310001819810srt:EuropeMember2025-01-012025-12-310001819810rdw:OtherGeographicalAreasMemberrdw:SpaceSegmentMember2025-01-012025-12-310001819810rdw:OtherGeographicalAreasMemberrdw:DefenseTechSegmentMember2025-01-012025-12-310001819810rdw:OtherGeographicalAreasMember2025-01-012025-12-310001819810rdw:CivilSpaceMemberrdw:SpaceSegmentMember2024-01-012024-12-310001819810rdw:CivilSpaceMemberrdw:DefenseTechSegmentMember2024-01-012024-12-310001819810rdw:CivilSpaceMember2024-01-012024-12-310001819810rdw:NationalSecurityMemberrdw:SpaceSegmentMember2024-01-012024-12-310001819810rdw:NationalSecurityMemberrdw:DefenseTechSegmentMember2024-01-012024-12-310001819810rdw:NationalSecurityMember2024-01-012024-12-310001819810rdw:CommercialAndOtherMemberrdw:SpaceSegmentMember2024-01-012024-12-310001819810rdw:CommercialAndOtherMemberrdw:DefenseTechSegmentMember2024-01-012024-12-310001819810rdw:CommercialAndOtherMember2024-01-012024-12-310001819810country:USrdw:SpaceSegmentMember2024-01-012024-12-310001819810country:USrdw:DefenseTechSegmentMember2024-01-012024-12-310001819810country:US2024-01-012024-12-310001819810srt:EuropeMemberrdw:SpaceSegmentMember2024-01-012024-12-310001819810srt:EuropeMemberrdw:DefenseTechSegmentMember2024-01-012024-12-310001819810srt:EuropeMember2024-01-012024-12-310001819810rdw:OtherGeographicalAreasMemberrdw:SpaceSegmentMember2024-01-012024-12-310001819810rdw:OtherGeographicalAreasMemberrdw:DefenseTechSegmentMember2024-01-012024-12-310001819810rdw:OtherGeographicalAreasMember2024-01-012024-12-310001819810rdw:SpaceSegmentMember2023-01-012023-12-310001819810rdw:DefenseTechSegmentMember2023-01-012023-12-310001819810rdw:CivilSpaceMemberrdw:SpaceSegmentMember2023-01-012023-12-310001819810rdw:CivilSpaceMemberrdw:DefenseTechSegmentMember2023-01-012023-12-310001819810rdw:CivilSpaceMember2023-01-012023-12-310001819810rdw:NationalSecurityMemberrdw:SpaceSegmentMember2023-01-012023-12-310001819810rdw:NationalSecurityMemberrdw:DefenseTechSegmentMember2023-01-012023-12-310001819810rdw:NationalSecurityMember2023-01-012023-12-310001819810rdw:CommercialAndOtherMemberrdw:SpaceSegmentMember2023-01-012023-12-310001819810rdw:CommercialAndOtherMemberrdw:DefenseTechSegmentMember2023-01-012023-12-310001819810rdw:CommercialAndOtherMember2023-01-012023-12-310001819810country:USrdw:SpaceSegmentMember2023-01-012023-12-310001819810country:USrdw:DefenseTechSegmentMember2023-01-012023-12-310001819810country:US2023-01-012023-12-310001819810srt:EuropeMemberrdw:SpaceSegmentMember2023-01-012023-12-310001819810srt:EuropeMemberrdw:DefenseTechSegmentMember2023-01-012023-12-310001819810srt:EuropeMember2023-01-012023-12-310001819810rdw:OtherGeographicalAreasMemberrdw:SpaceSegmentMember2023-01-012023-12-310001819810rdw:OtherGeographicalAreasMemberrdw:DefenseTechSegmentMember2023-01-012023-12-310001819810rdw:OtherGeographicalAreasMember2023-01-012023-12-310001819810rdw:CustomerAMemberus-gaap:CustomerConcentrationRiskMemberus-gaap:RevenueFromContractWithCustomerMember2025-01-012025-12-310001819810rdw:CustomerAMemberus-gaap:CustomerConcentrationRiskMemberus-gaap:RevenueFromContractWithCustomerMember2024-01-012024-12-310001819810rdw:CustomerAMemberus-gaap:CustomerConcentrationRiskMemberus-gaap:RevenueFromContractWithCustomerMember2023-01-012023-12-310001819810rdw:CustomerBMemberus-gaap:CustomerConcentrationRiskMemberus-gaap:RevenueFromContractWithCustomerMember2025-01-012025-12-310001819810rdw:CustomerBMemberus-gaap:CustomerConcentrationRiskMemberus-gaap:RevenueFromContractWithCustomerMember2024-01-012024-12-310001819810rdw:CustomerBMemberus-gaap:CustomerConcentrationRiskMemberus-gaap:RevenueFromContractWithCustomerMember2023-01-012023-12-310001819810rdw:CustomerDMemberus-gaap:CustomerConcentrationRiskMemberus-gaap:RevenueFromContractWithCustomerMember2025-01-012025-12-310001819810rdw:CustomerDMemberus-gaap:CustomerConcentrationRiskMemberus-gaap:RevenueFromContractWithCustomerMember2024-01-012024-12-310001819810rdw:CustomerDMemberus-gaap:CustomerConcentrationRiskMemberus-gaap:RevenueFromContractWithCustomerMember2023-01-012023-12-310001819810rdw:CustomerEMemberus-gaap:CustomerConcentrationRiskMemberus-gaap:RevenueFromContractWithCustomerMember2025-01-012025-12-310001819810rdw:CustomerEMemberus-gaap:CustomerConcentrationRiskMemberus-gaap:RevenueFromContractWithCustomerMember2024-01-012024-12-310001819810rdw:CustomerEMemberus-gaap:CustomerConcentrationRiskMemberus-gaap:RevenueFromContractWithCustomerMember2023-01-012023-12-310001819810us-gaap:ContractsAccountedForUnderPercentageOfCompletionMember2025-01-012025-12-310001819810us-gaap:ContractsAccountedForUnderPercentageOfCompletionMember2024-01-012024-12-310001819810us-gaap:ContractsAccountedForUnderPercentageOfCompletionMember2023-01-012023-12-3100018198102026-01-012025-12-3100018198102027-10-012025-12-310001819810rdw:Redwire401kPlanMember2024-01-012024-12-310001819810rdw:Redwire401kPlanMember2023-01-012023-12-310001819810rdw:Redwire401kPlanMember2025-01-012025-12-310001819810rdw:OneToFourPercentMemberrdw:Edge401kPlanMember2025-01-012025-12-310001819810rdw:FiveToSixPercentMemberrdw:Edge401kPlanMember2025-01-012025-12-310001819810rdw:EdgeIncentiveUnitPlanMember2025-06-230001819810srt:MinimumMember2025-06-230001819810srt:MaximumMember2025-06-230001819810srt:MinimumMemberrdw:EdgeIncentiveUnitPlanMember2025-06-232025-06-230001819810srt:MaximumMemberrdw:EdgeIncentiveUnitPlanMember2025-06-232025-06-230001819810rdw:EdgeIncentiveUnitPlanMember2025-06-232025-06-230001819810srt:MinimumMemberrdw:TrancheIIAndIIIEdgeIncentiveUnitsMember2025-06-012025-06-300001819810srt:MaximumMemberrdw:TrancheIIAndIIIEdgeIncentiveUnitsMember2025-06-012025-06-300001819810rdw:TrancheIIAndIIIEdgeIncentiveUnitsMember2025-12-310001819810rdw:TrancheIIAndIIIEdgeIncentiveUnitsMember2025-01-012025-12-310001819810us-gaap:EmployeeStockOptionMember2025-01-012025-12-310001819810us-gaap:EmployeeStockOptionMemberus-gaap:ShareBasedCompensationAwardTrancheOneMember2025-01-012025-12-310001819810us-gaap:EmployeeStockOptionMemberus-gaap:ShareBasedCompensationAwardTrancheTwoMember2025-01-012025-12-310001819810us-gaap:EmployeeStockOptionMemberus-gaap:ShareBasedCompensationAwardTrancheThreeMember2025-01-012025-12-310001819810us-gaap:EmployeeStockOptionMember2024-01-012024-12-310001819810us-gaap:EmployeeStockOptionMember2023-01-012023-12-310001819810rdw:PerformanceBasedRestrictedStockUnitsMember2025-01-012025-12-310001819810srt:MinimumMemberrdw:PerformanceBasedRestrictedStockUnitsMember2025-01-012025-12-310001819810srt:MaximumMemberrdw:PerformanceBasedRestrictedStockUnitsMember2025-01-012025-12-310001819810rdw:OfficersManagersAndOtherEligibleEmployeesMemberrdw:PerformanceBasedRestrictedStockUnitsMember2025-01-012025-12-310001819810rdw:PerformanceBasedRestrictedStockUnitsMember2025-12-310001819810rdw:PerformanceBasedRestrictedStockUnitsMember2024-12-310001819810rdw:PerformanceBasedRestrictedStockUnitsMember2023-12-310001819810rdw:PerformanceBasedRestrictedStockUnitsMember2024-01-012024-12-310001819810rdw:PerformanceBasedRestrictedStockUnitsMember2023-01-012023-12-310001819810us-gaap:RestrictedStockUnitsRSUMemberus-gaap:ShareBasedPaymentArrangementNonemployeeMember2025-01-012025-12-310001819810us-gaap:RestrictedStockUnitsRSUMemberus-gaap:ShareBasedPaymentArrangementEmployeeMember2025-01-012025-12-310001819810us-gaap:RestrictedStockUnitsRSUMember2024-12-310001819810us-gaap:RestrictedStockUnitsRSUMember2024-01-012024-12-310001819810us-gaap:RestrictedStockUnitsRSUMember2025-01-012025-12-310001819810us-gaap:RestrictedStockUnitsRSUMember2025-12-310001819810us-gaap:EmployeeStockMember2025-12-310001819810us-gaap:EmployeeStockMember2024-12-310001819810us-gaap:EmployeeStockMember2021-09-022021-09-020001819810us-gaap:CostOfSalesMemberrdw:EdgeIncentiveUnitPlanMember2025-01-012025-12-310001819810us-gaap:CostOfSalesMemberrdw:EdgeIncentiveUnitPlanMember2024-01-012024-12-310001819810us-gaap:CostOfSalesMemberrdw:EdgeIncentiveUnitPlanMember2023-01-012023-12-310001819810us-gaap:CostOfSalesMemberus-gaap:EmployeeStockMember2025-01-012025-12-310001819810us-gaap:CostOfSalesMemberus-gaap:EmployeeStockMember2024-01-012024-12-310001819810us-gaap:CostOfSalesMemberus-gaap:EmployeeStockMember2023-01-012023-12-310001819810us-gaap:CostOfSalesMemberus-gaap:EmployeeStockOptionMember2025-01-012025-12-310001819810us-gaap:CostOfSalesMemberus-gaap:EmployeeStockOptionMember2024-01-012024-12-310001819810us-gaap:CostOfSalesMemberus-gaap:EmployeeStockOptionMember2023-01-012023-12-310001819810us-gaap:CostOfSalesMemberus-gaap:RestrictedStockUnitsRSUMember2025-01-012025-12-310001819810us-gaap:CostOfSalesMemberus-gaap:RestrictedStockUnitsRSUMember2024-01-012024-12-310001819810us-gaap:CostOfSalesMemberus-gaap:RestrictedStockUnitsRSUMember2023-01-012023-12-310001819810us-gaap:CostOfSalesMemberrdw:PerformanceBasedRestrictedStockUnitsMember2025-01-012025-12-310001819810us-gaap:CostOfSalesMemberrdw:PerformanceBasedRestrictedStockUnitsMember2024-01-012024-12-310001819810us-gaap:CostOfSalesMemberrdw:PerformanceBasedRestrictedStockUnitsMember2023-01-012023-12-310001819810us-gaap:CostOfSalesMember2025-01-012025-12-310001819810us-gaap:CostOfSalesMember2024-01-012024-12-310001819810us-gaap:CostOfSalesMember2023-01-012023-12-310001819810us-gaap:SellingGeneralAndAdministrativeExpensesMemberrdw:EdgeIncentiveUnitPlanMember2025-01-012025-12-310001819810us-gaap:SellingGeneralAndAdministrativeExpensesMemberrdw:EdgeIncentiveUnitPlanMember2024-01-012024-12-310001819810us-gaap:SellingGeneralAndAdministrativeExpensesMemberrdw:EdgeIncentiveUnitPlanMember2023-01-012023-12-310001819810us-gaap:SellingGeneralAndAdministrativeExpensesMemberus-gaap:EmployeeStockMember2025-01-012025-12-310001819810us-gaap:SellingGeneralAndAdministrativeExpensesMemberus-gaap:EmployeeStockMember2024-01-012024-12-310001819810us-gaap:SellingGeneralAndAdministrativeExpensesMemberus-gaap:EmployeeStockMember2023-01-012023-12-310001819810us-gaap:SellingGeneralAndAdministrativeExpensesMemberus-gaap:EmployeeStockOptionMember2025-01-012025-12-310001819810us-gaap:SellingGeneralAndAdministrativeExpensesMemberus-gaap:EmployeeStockOptionMember2024-01-012024-12-310001819810us-gaap:SellingGeneralAndAdministrativeExpensesMemberus-gaap:EmployeeStockOptionMember2023-01-012023-12-310001819810us-gaap:SellingGeneralAndAdministrativeExpensesMemberus-gaap:RestrictedStockUnitsRSUMember2025-01-012025-12-310001819810us-gaap:SellingGeneralAndAdministrativeExpensesMemberus-gaap:RestrictedStockUnitsRSUMember2024-01-012024-12-310001819810us-gaap:SellingGeneralAndAdministrativeExpensesMemberus-gaap:RestrictedStockUnitsRSUMember2023-01-012023-12-310001819810us-gaap:SellingGeneralAndAdministrativeExpensesMemberrdw:PerformanceBasedRestrictedStockUnitsMember2025-01-012025-12-310001819810us-gaap:SellingGeneralAndAdministrativeExpensesMemberrdw:PerformanceBasedRestrictedStockUnitsMember2024-01-012024-12-310001819810us-gaap:SellingGeneralAndAdministrativeExpensesMemberrdw:PerformanceBasedRestrictedStockUnitsMember2023-01-012023-12-310001819810us-gaap:SellingGeneralAndAdministrativeExpensesMember2025-01-012025-12-310001819810us-gaap:SellingGeneralAndAdministrativeExpensesMember2024-01-012024-12-310001819810us-gaap:SellingGeneralAndAdministrativeExpensesMember2023-01-012023-12-310001819810rdw:RelatedPartyAMemberus-gaap:RelatedPartyMember2025-12-310001819810rdw:RelatedPartyAMemberus-gaap:RelatedPartyMember2024-12-310001819810rdw:RelatedPartyBMemberus-gaap:RelatedPartyMember2025-12-310001819810rdw:RelatedPartyBMemberus-gaap:RelatedPartyMember2024-12-310001819810us-gaap:RelatedPartyMember2025-12-310001819810us-gaap:RelatedPartyMember2024-12-310001819810rdw:RelatedPartyAMemberus-gaap:RelatedPartyMember2025-01-012025-12-310001819810rdw:RelatedPartyAMemberus-gaap:RelatedPartyMember2024-01-012024-12-310001819810rdw:RelatedPartyAMemberus-gaap:RelatedPartyMember2023-01-012023-12-310001819810rdw:RelatedPartyBMemberus-gaap:RelatedPartyMember2025-01-012025-12-310001819810rdw:RelatedPartyBMemberus-gaap:RelatedPartyMember2024-01-012024-12-310001819810rdw:RelatedPartyBMemberus-gaap:RelatedPartyMember2023-01-012023-12-310001819810us-gaap:RelatedPartyMember2025-01-012025-12-310001819810us-gaap:RelatedPartyMember2024-01-012024-12-310001819810us-gaap:RelatedPartyMember2023-01-012023-12-3100018198102025-10-012025-12-310001819810us-gaap:IntersegmentEliminationMember2025-01-012025-12-310001819810us-gaap:IntersegmentEliminationMember2024-01-012024-12-310001819810us-gaap:IntersegmentEliminationMember2023-01-012023-12-310001819810us-gaap:OperatingSegmentsMemberrdw:SpaceSegmentMember2025-01-012025-12-310001819810us-gaap:OperatingSegmentsMemberrdw:SpaceSegmentMember2024-01-012024-12-310001819810us-gaap:OperatingSegmentsMemberrdw:SpaceSegmentMember2023-01-012023-12-310001819810us-gaap:OperatingSegmentsMemberrdw:DefenseTechSegmentMember2025-01-012025-12-310001819810us-gaap:OperatingSegmentsMemberrdw:DefenseTechSegmentMember2024-01-012024-12-310001819810us-gaap:OperatingSegmentsMemberrdw:DefenseTechSegmentMember2023-01-012023-12-310001819810us-gaap:OperatingSegmentsMember2025-01-012025-12-310001819810us-gaap:OperatingSegmentsMember2024-01-012024-12-310001819810us-gaap:OperatingSegmentsMember2023-01-012023-12-310001819810us-gaap:CorporateNonSegmentMember2025-01-012025-12-310001819810us-gaap:CorporateNonSegmentMember2024-01-012024-12-310001819810us-gaap:CorporateNonSegmentMember2023-01-012023-12-310001819810us-gaap:RevolvingCreditFacilityMemberrdw:JPMAmendedAndRestatedCreditAgreementMemberus-gaap:LineOfCreditMemberus-gaap:SubsequentEventMember2026-02-200001819810us-gaap:MediumTermNotesMemberrdw:JPMAmendedAndRestatedCreditAgreementMemberus-gaap:LineOfCreditMemberus-gaap:SubsequentEventMember2026-02-200001819810us-gaap:SecuredOvernightFinancingRateSofrMemberrdw:JPMAmendedAndRestatedCreditAgreementMemberus-gaap:SubsequentEventMembersrt:MinimumMemberus-gaap:LineOfCreditMember2026-02-202026-02-200001819810us-gaap:SecuredOvernightFinancingRateSofrMemberrdw:JPMAmendedAndRestatedCreditAgreementMemberus-gaap:SubsequentEventMembersrt:MaximumMemberus-gaap:LineOfCreditMember2026-02-202026-02-200001819810us-gaap:BaseRateMemberrdw:JPMAmendedAndRestatedCreditAgreementMemberus-gaap:SubsequentEventMembersrt:MinimumMemberus-gaap:LineOfCreditMember2026-02-202026-02-200001819810us-gaap:BaseRateMemberrdw:JPMAmendedAndRestatedCreditAgreementMemberus-gaap:SubsequentEventMembersrt:MaximumMemberus-gaap:LineOfCreditMember2026-02-202026-02-20
UNITED STATES
SECURITIES AND EXCHANGE COMMISSION
Washington, D.C. 20549
FORM 10-K
(Mark One)
| | | | | |
☒ | ANNUAL REPORT PURSUANT TO SECTION 13 OR 15(d) OF THE SECURITIES EXCHANGE ACT OF 1934 |
For the fiscal year ended December 31, 2025
OR
| | | | | |
☐ | TRANSITION REPORT PURSUANT TO SECTION 13 OR 15(d) OF THE SECURITIES EXCHANGE ACT OF 1934 |
For the transition period from to
Commission file number 001-39733
Redwire Corporation
(Exact name of registrant as specified in its charter)
| | | | | | | | |
Delaware | | 88-1818410 |
(State or other jurisdiction of incorporation or organization) | | (I.R.S. Employer Identification No.) |
| | |
8226 Philips Highway, Suite 101 Jacksonville, Florida | | 32256 |
(Address of Principal Executive Offices) | | (Zip Code) |
Registrant's telephone number, including area code: (650) 701-7722
Securities registered pursuant to Section 12(b) of the Act:
| | | | | | | | |
| Title of each class | Trading Symbol(s) | Name of each exchange on which registered |
| Common Stock, par value $0.0001 per share | RDW | New York Stock Exchange |
| | |
Securities registered pursuant to section 12(g) of the Act: None
Indicate by check mark if the registrant is a well-known seasoned issuer, as defined in Rule 405 of the Securities Act. Yes ☒ No o
Indicate by check mark if the registrant is not required to file reports pursuant to Section 13 or Section 15(d) of the Act. Yes o No ☒
Indicate by check mark whether the registrant: (1) has filed all reports required to be filed by Section 13 or 15(d) of the Securities Exchange Act of 1934 during the preceding 12 months (or for such shorter period that the registrant was required to file such reports), and (2) has been subject to such filing requirements for the past 90 days. Yes ☒ No ☐
Indicate by check mark whether the registrant has submitted electronically every Interactive Data File required to be submitted pursuant to Rule 405 of Regulation S-T (§232.405 of this chapter) during the preceding 12 months (or for such shorter period that the registrant was required to submit such files). Yes ☒ No ☐
Indicate by check mark whether the registrant is a large accelerated filer, an accelerated filer, a non-accelerated filer, a smaller reporting company, or an emerging growth company. See the definitions of “large accelerated filer,” “accelerated filer,” “smaller reporting company” and “emerging growth company” in Rule 12b-2 of the Exchange Act. (Check one):
| | | | | | | | | | | |
| Large accelerated filer | ☒ | Accelerated filer | ☐ |
| Non-accelerated filer | ☐ | Smaller reporting company | ☒ |
| | Emerging growth company | ☐ |
If an emerging growth company, indicate by check mark if the registrant has elected not to use the extended transition period for complying with any new or revised financial accounting standards provided pursuant 13(a) of the Exchange Act. ☐
Indicate by check mark whether the registrant has filed a report on and attestation to its management’s assessment of the effectiveness of its internal control over financial reporting under Section 404(b) of the Sarbanes-Oxley Act (15 U.S.C.7262(b)) by the registered public accounting firm that prepared or issued its audit report. ☒
If securities are registered pursuant to Section 12(b) of the Act, indicate by check mark whether the financial statements of the registrant included in the filing reflect the correction of an error to previously issued financial statements. ☐
Indicate by check mark whether any of those error corrections are restatements that required a recovery analysis of incentive-based compensation received by any of the registrant’s executive officers during the relevant recovery period pursuant to §240.10D-1(b). ☐
Indicate by check mark whether the registrant is a shell company (as defined in Rule 12b-2 of the Act). Yes ☐ No ☒
The aggregate market value of the voting and non-voting common equity held by non-affiliates of the registrant as of June 30, 2025 was approximately $895.6 million based on the closing price of $16.30 for the shares of the registrant’s common stock, as reported by the New York Stock Exchange. The determination of affiliate status is not necessarily a conclusive determination for other purposes.
The registrant had outstanding 191,975,804 shares of common stock as of February 23, 2026.
DOCUMENTS INCORPORATED BY REFERENCE
Certain information in the registrant’s definitive proxy statement to be filed with the Securities and Exchange Commission relating to the registrant’s 2026 Annual Meeting of Shareholders is incorporated by reference into Part III of this Annual Report on Form 10-K.
REDWIRE CORPORATION
Annual Report on Form 10-K
December 31, 2025
Table of Contents
PART I
Each of the terms the “Company,” “Redwire,” “we,” “our,” “us” and similar terms used herein refer collectively to Redwire Corporation, a Delaware corporation, and its consolidated subsidiaries, unless otherwise stated.
CAUTIONARY NOTE REGARDING FORWARD-LOOKING STATEMENTS
This Annual Report on Form 10-K contains statements that constitute “forward-looking statements” within the meaning of the Private Securities Litigation Reform Act of 1995 concerning us and other matters. Words such as “will,” “expect,” “anticipate,” “intend,” “may,” “could,” “should,” “plan,” “project,” “forecast,” “believe,” “estimate,” “outlook,” “trends,” “goals,” “contemplate,” “continue,” “might,” “possible,” “potential,” “predict,” “would” and similar expressions generally identify these forward-looking statements, but the absence of these words does not mean that a statement is not forward-looking. Forward-looking statements include, among other things, statements relating to our future financial condition, results of operations and/or cash flows, and our projects and related timelines. Forward-looking statements are based upon assumptions, expectations, plans and projections that we believe to be reasonable when made, but which may change over time. These statements are not guarantees of future performance and inherently involve a wide range of risks and uncertainties that are difficult to predict. Specific risks and uncertainties that could cause actual results to differ materially from those expressed or implied in these forward-looking statements include, but are not limited to, those identified in this Annual Report on Form 10-K, particularly in Part I, Item 1A. “Risk Factors,” and Part II, Item 7 “Management’s Discussion and Analysis of Financial Condition and Results of Operations,” and other important factors disclosed from time to time in our other filings with the Securities and Exchange Commission (“SEC”).
Undue reliance should not be placed on these forward-looking statements. The forward-looking statements contained in this Annual Report on Form 10-K are based on current expectations and beliefs concerning future developments and their potential effects on us. There can be no assurance that future developments affecting us will be those that we have anticipated. We do not undertake any obligation to update or revise any forward-looking statements, whether as a result of new information, future events or otherwise, except as may be required under applicable securities laws.
WEBSITE AND SOCIAL MEDIA DISCLOSURE
We use our website (www.rdw.com) and our corporate Facebook, X, LinkedIn, and Instagram accounts as channels of distribution of Company information. The information we post through these channels may be deemed material. Accordingly, investors should monitor these channels, in addition to following our press releases, SEC filings and public conference calls and webcasts. The contents of our website and social media channels are not, however, a part of this report.
TRADEMARKS
We own or have the rights to use various trademarks referred to in this Annual Report on Form 10-K and their respective logos. Solely for convenience, we may refer to trademarks in this Annual Report on Form 10-K without the TM and ® symbols. Such references are not intended to indicate, in any way, that we will not assert, to the fullest extent permitted by law, our rights to our trademarks. Other trademarks appearing in this Annual Report on Form 10-K are the property of their respective owners.
MARKET AND INDUSTRY INFORMATION
Market data used throughout this Annual Report on Form 10-K is based on management’s knowledge of the industry and the good faith estimates of management. All of management’s estimates presented herein are based on industry sources, including analyst reports and management’s knowledge. We also relied, to the extent available, upon management’s review of independent industry surveys and publications prepared by a number of sources and other publicly available information. We are responsible for all of the disclosure in this Annual Report on Form 10-K and while we believe that each of the publications, studies and surveys used throughout this Annual Report on Form 10-K are prepared by reputable sources, we have not independently verified market and industry data from third-party sources.
All of the market data used in this Annual Report on Form 10-K involves a number of assumptions and limitations, and you are cautioned not to give undue weight to such estimates. While we believe the estimated market position, market opportunity and market size information included in this Annual Report on Form 10-K is generally reliable, such information, which in part is derived from management’s estimates and beliefs, is inherently uncertain and imprecise and has not been verified by any independent source. Projections, assumptions and estimates of our future performance and the future performance of the industry in which we operate are necessarily subject to a high degree of uncertainty and risk due to a variety of factors, including those described in “Item 1A Risk Factors” of Part I of this Annual Report on Form 10-K and elsewhere in this Annual Report on Form 10-K. These and other factors could cause results to differ materially from those expressed in our estimates and beliefs and in the estimates prepared by independent parties. See “Cautionary Note Regarding Forward-Looking Statements” above.
Item 1. Business
General
Redwire is an integrated space and defense technology company focused on advanced technologies. The Company’s vision is to pioneer next-generation space and defense technologies that empower scientific discovery, advance global industries, and strengthen security - transforming how humanity explores, connects, and protects - from the skies above to the stars beyond. Powered by this vision, Redwire is building the future of aerospace infrastructure, autonomous systems, and multi-domain operations, leveraging digital engineering and artificial intelligence (“AI”) automation.
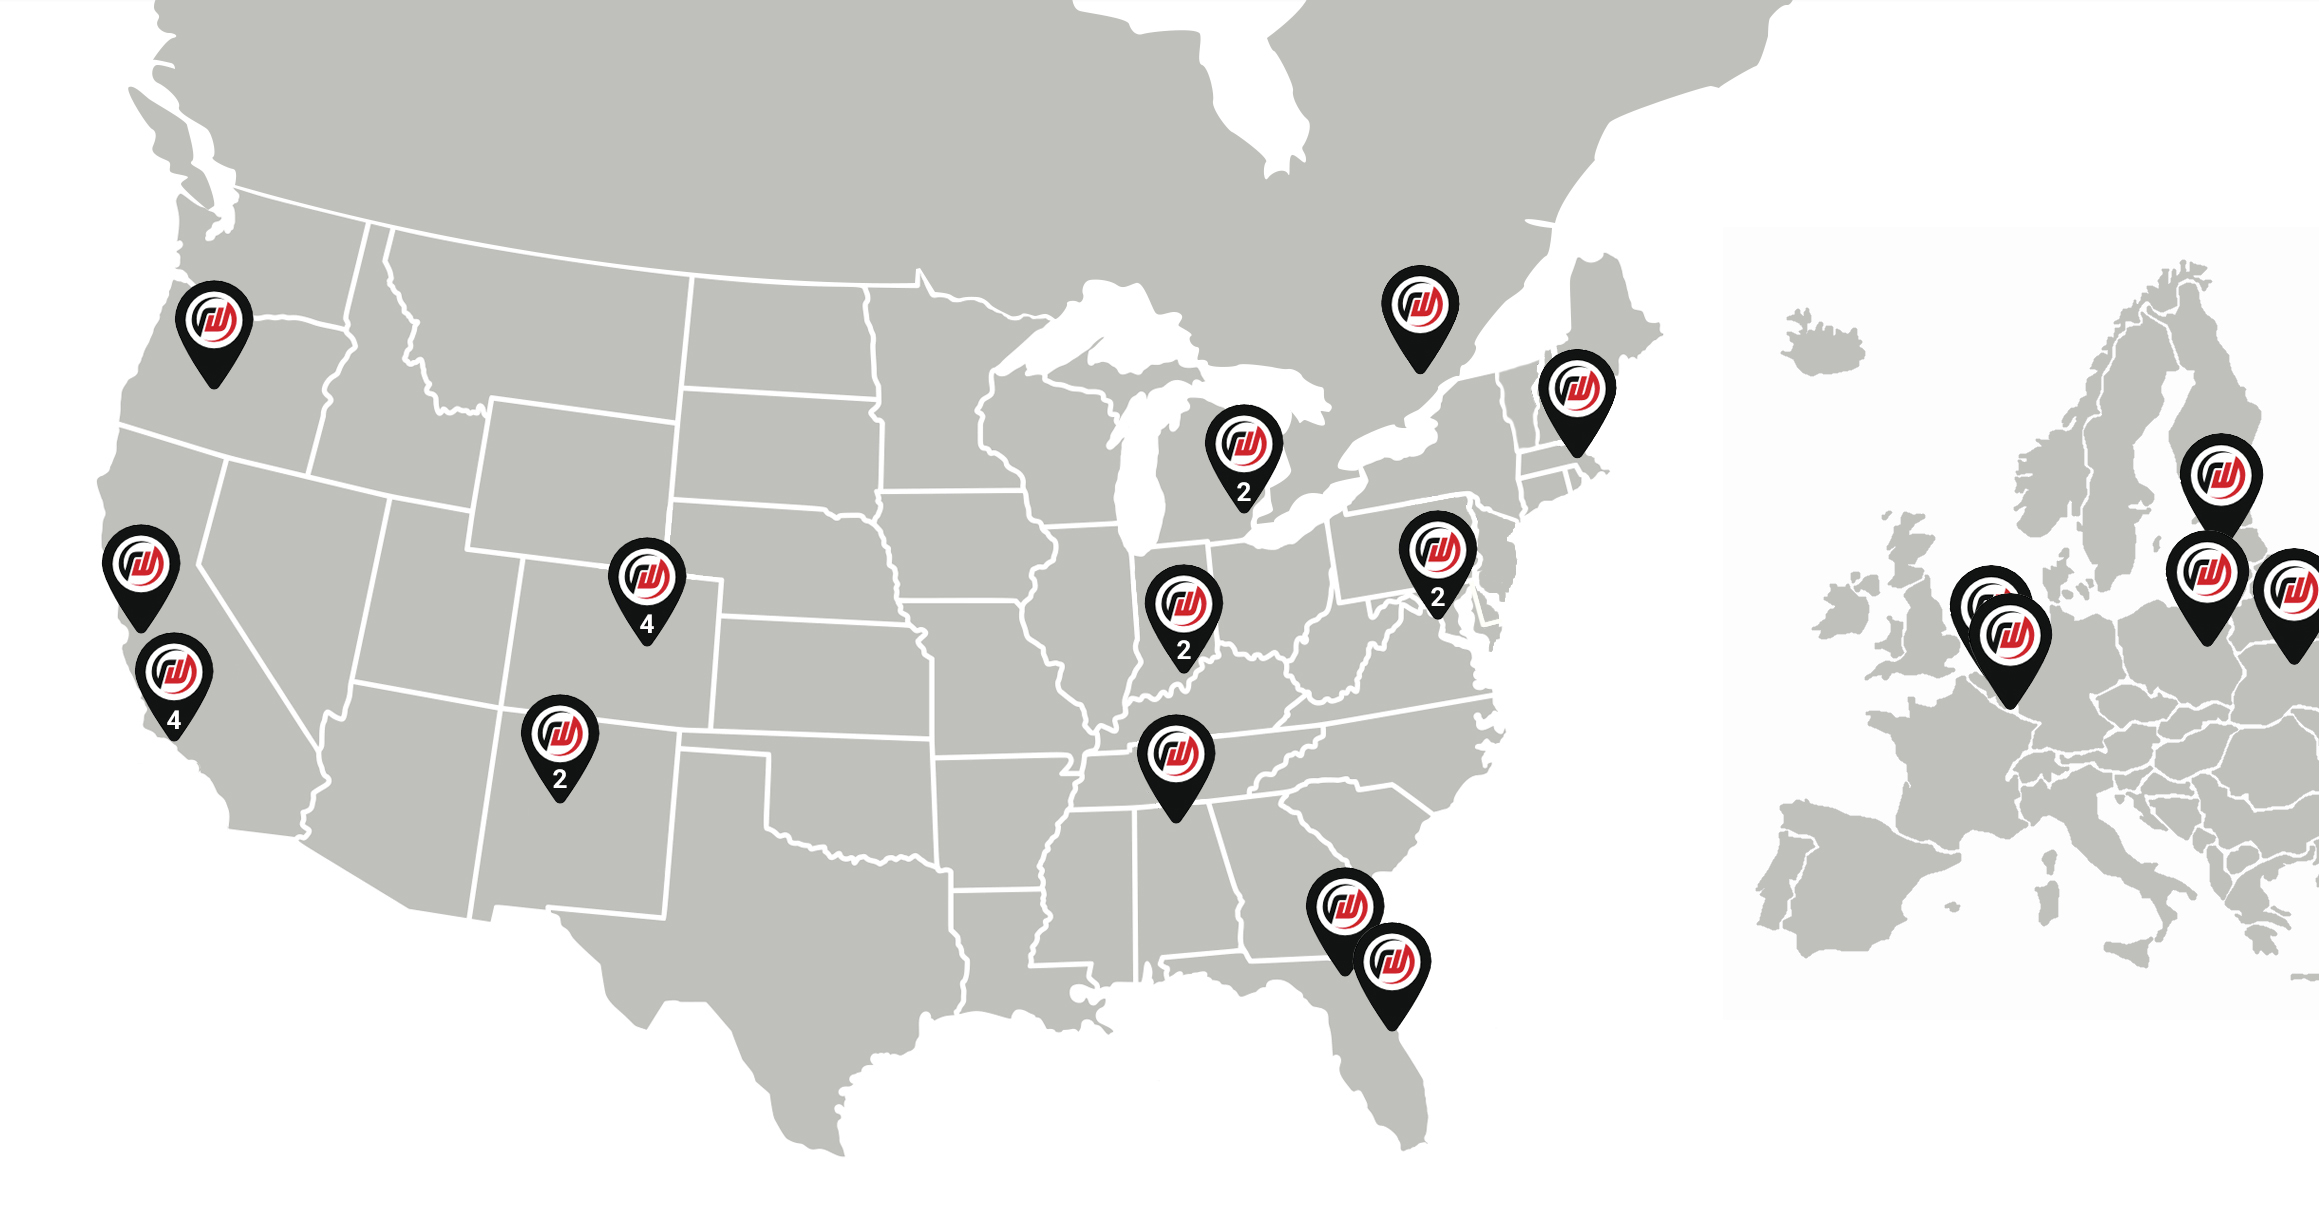
Redwire’s broad portfolio of airborne and space-based systems combine decades of flight heritage with an agile and innovative culture. Through its global operations, Redwire’s technologies are deployed across national security, civil, and commercial space and defense technology market segments globally. Operating out of 28 locations in North America and Europe, Redwire serves a diverse set of domestic and international customers. For a discussion of risks associated with our operations, refer to Item 1A. “Risk Factors.”
Redwire’s strategy to accelerate growth includes bundled sales and increased levels of offering integrations, such as systems, payloads, space and airborne platforms and full mission solutions. Our strategy also includes strategic acquisitions to complement and expand the Company’s space and defense technologies. Our scale, reputation for quality and relationships allow us to be agile and innovative in our approach to pursuing growth through business models, partnerships and acquisitions.
Effective December 1, 2025, the Company operated in two operating segments and two reportable segments: Space and Defense Tech. Refer to Note B – Summary of Significant Accounting Policies and Note U – Segment Reporting of the accompanying notes to the consolidated financial statements for additional information regarding this conclusion.
Space Segment Business Strategy
Redwire’s Space segment focuses on delivering next-generation spacecraft, large space infrastructure, and microgravity capabilities to serve civil, national security, and commercial space customers globally. Redwire’s core space offerings are flight-proven and have supported hundreds of spacecraft, missions, and operations, including, but not limited to, the International Space Station (“ISS”), European Space Agency’s (“ESA”) Project for On-Board Autonomy (“PROBA”) missions, National Aeronautics and Space Administration’s (“NASA”) Double Asteroid Redirection Test (“DART”) and Artemis I lunar mission, and Space Force’s GPS Satellite program.
Next-Generation Spacecraft
Redwire’s spacecraft portfolio features a lineup of five platforms - SabreSat, Phantom, Hammerhead, Thresher, and Mako - designed to operate across multiple orbits ranging from Very Low Earth Orbit (“VLEO”), Low Earth Orbit (“LEO”), Medium Earth Orbit (“MEO”), Geostationary Orbit (“GEO”) and beyond GEO (“X-GEO”). For VLEO, Redwire offers two spacecraft: U.S.-built SaberSat and the European-built Phantom spacecraft. Both VLEO spacecraft are designed to unlock capability in a less congested orbit where proximity to Earth provides imaging and low latency advantages. Redwire is the prime mission integrator on the Defense Advanced Research Projects Agency’s (“DARPA”) Otter program in the U.S., which is leveraging the SabreSat platform to develop a revolutionary air-breathing satellite system and will demonstrate the use of novel electric propulsion in VLEO. Additionally, Redwire’s Phantom spacecraft is being used on ESA’s Skimsat VLEO program.
In LEO, Redwire offers its U.S.-built Thresher spacecraft. In MEO and GEO, Redwire offers its U.S.-built Mako spacecraft. Both platforms are designed for challenging missions that address dynamic space operations where maneuverability, precision accuracy, and autonomous operation are critical. Mako is designed for high precision rendezvous proximity operations (“RPO”), docking, and in-space refueling. It has the capability to support dynamic space operations and the adaptability to host a variety of mission payloads. Additionally, Mako serves space situational awareness and scientific missions at GEO and X-GEO orbits. Thresher is also highly maneuverable and is designed for rapid response, having demonstrated the capability to deliver within one year after contract award.
Redwire also provides the EU-based LEO Hammerhead, a small satellite platform which is capable of supporting payloads of up to 70 kg and targets spacecraft with a mass of less than 200 kg, making it compatible with typical shared launch opportunities and small satellite launchers. The Hammerhead platform is an evolution of the PROBA platform, which has accumulated extensive flight heritage of more than 50 years in orbit without failure on any of the launched satellites. We are leading small satellite pioneering research missions like PROBA-1 and PROBA-3, ESA’s small satellite with fully autonomous capabilities, and PROBA-V, ESA’s operational Earth observation mission based on a small satellite. The PROBA-3 satellites demonstrate precision formation flying, a foundational building block to the advancement of future multi-satellite missions.
Redwire also provides software that supports mission assessments and design of new missions such as operation in VLEO and dynamic space operations in GEO. Redwire’s digital engineering facilitates the modeling and simulation of prospective space architectures to support trade analysis, operational concepts, and testing. Redwire leverages high-fidelity digital engineering tools and
model-based systems engineering to produce end-to-end virtual environments that decrease cost, increase speed to market, and enable mission optimization. Redwire has a proprietary enterprise software suite that enables digital engineering and generation of high-fidelity, interactive modeling and simulations of individual components, as well as entire spacecraft and full constellations in a cloud-based environment.
Large Space Infrastructure
Redwire is a leading innovator in space infrastructure, enabling space mission providers with the foundational building blocks and integrated solutions needed for complex space missions in areas including power generation and spacecraft docking. Redwire is developing critical space infrastructure that is impacting our terrestrial economy in areas, such as national security, global defense, telecommunications, navigation and timing, and Earth observation.
Power generation is critical for space missions and Redwire offers a variety of solar array solutions for spacecraft, spanning the spectrum of size, power needs, and desired orbit. Redwire’s proprietary technologies, technical experience, and large-scale production facilities enable the Company to design, build, and deliver competitive power generation solutions tailored to customer needs. Redwire’s patented and award-winning Roll-Out Solar Array (“ROSA”) technology features an innovative “roll-out” design that uses composite booms to serve as both the primary structural elements and the deployment actuator, and a modular photovoltaic blanket assembly that can be configured into a variety of solar array architectures. When configured for launch, ROSA stows into a compact cylindrical volume yielding efficient space utilization, which allows extremely large solar arrays to be stowed compactly within launch vehicles.
Redwire’s power systems have successfully deployed on several flight missions in LEO, GEO, and deep space, including on the ISS, NASA’s Imaging X-ray Polarimetry Explorer (“IXPE”) mission, and NASA’s DART mission.
Additionally, to enable some of humanity’s most advanced missions in LEO and deep space, Redwire has developed a state-of-the-art docking system, the International Berthing and Docking Mechanism (“IBDM”), to support autonomous rendezvous and docking capabilities for spacecraft. The IBDM is fully computer-controlled and designed for use with both large mass and lightweight spacecraft. Redwire’s IBDM system is fully aligned with the international docking system standard and can be used for autonomous docking of crewed vehicles, cargo vehicles station modules as well as resource transfer through automated umbilical mating.
Microgravity Development
Microgravity provides unique conditions for scientific exploration which cannot be replicated on Earth. Redwire’s microgravity payloads are enabling next-generation capabilities and services, including space-based biotechnology applications, plant and animal science, in-space additive manufacturing, in-space advanced material manufacturing and support of human exploration and habitation. There are currently eleven active payload facilities built by Redwire on the ISS as of December 31, 2025.
The microgravity environment enables certain products and materials to be manufactured with enhanced and/or differentiated properties that are not comparable to products manufactured on Earth. These products and materials include the production of pharmaceutical seed crystals used for drug development processes as pharmaceutical companies look to deliver new, optimized treatments for patients on Earth. The Redwire Pharmaceutical In-space Laboratory – Bio-crystal Optimization eXperiment (“PIL-BOX”) payload offers pharmaceutical companies and researchers access to leverage the microgravity environment to grow crystals of protein-based pharmaceuticals and other key molecules. Redwire has launched 42 PIL-BOXes through December 31, 2025, for our partners including, but not limited to, Bristol Myers Squibb and Eli Lilly. Additionally, during 2025, Redwire entered into a licensing agreement with ExesaLibero Pharma, Inc., which provides for Redwire to receive royalties from any commercial sales of resulting pharmaceutical products.
In support of NASA’s Artemis program, we are also engaged in lunar research related to communications and navigation solutions as well as in-situ resource utilization. Redwire is developing Mason, which seeks to build critical infrastructure on the surface of the Moon, including shielding structures (e.g., berms), landing pads, roads, and foundations for habitats. These developments aim to aid in establishing long-term infrastructure to sustain humans on the moon, Mars, and beyond.
Defense Tech Segment Business Strategy
Redwire’s Defense Tech segment focuses on delivering combat-proven autonomous systems, optical sensors, advanced optics, resilient energy solutions and radio frequency payloads that provide intelligence, surveillance, and reconnaissance capabilities for customers including the U.S. Department of War (“DoW”, formerly known as the Department of Defense), U.S. Federal Civilian Agencies and allied governments across multiple domains.
The Defense Tech segment has its origins in aeronautical pioneering, with a legacy of producing innovative solutions that have advanced missions in countries around the world, with products currently deployed in approximately 80 countries. With nearly three decades of experience helping customers gain a critical advantage by harnessing the latest Uncrewed Aerial System (“UAS”)
technology for the military, first responders, commercial, and academia, Defense Tech’s rich history of proven leadership means that our customers benefit from decades of inventive engineering and customized mission support.
As the original equipment manufacturer (“OEM”) of the Stalker UAS, Penguin UAS, and Octopus line of optical gimbal payloads, Defense Tech offers a diverse ecosystem of products with global reach that includes manufacturing and flight test facilities in the U.S. and EU. On July 14, 2025, the Stalker UAS was granted an Authority to Operate by the Defense Innovation Unit and is now on the Defense Innovation Unit Blue UAS List, enabling streamlined deployment across U.S. government agencies.
Combat-Proven UAS
Redwire Defense Tech offers UASs that are purpose built to meet real-world mission needs. The Stalker series and Penguin series feature mission-driven technology and multi-mission flexibility that have been proven successful in even the most austere environments. With low logistics footprints, these aircraft can be deployed quickly and easily to provide rapid response for time-critical operations.
The Stalker Block 30 has been proven in operations worldwide for two decades, with thousands of flight hours across six continents, meeting mission needs for customers including, but not limited to, the U.S. Marine Corps, U.S. Army, and Five Eyes partners. An adaptable small UAS (“sUAS”), the Stalker provides long-endurance, long-range mission support in a wide variety of environments. Network-based avionics support multiple payloads simultaneously, rapid payload integration, and allow for configuration flexibility. The Stalker Block 30 performs fully autonomous Vertical Take Off and Landing (“VTOL”) with no operator input required. Using either a solid oxide fuel cell (“SOFC”) or a rechargeable battery, the Stalker provides the endurance needed to complete complex aerial operations.
As a leading provider of UAS, Redwire Defense Tech continuously enhances the performance of its products based on direct user feedback and years of deployed operations. Redwire Defense Tech’s mission-focused innovation enables it to meet customer needs with solutions that are ready for operational deployment.
The Stalker Block 40 is expected to provide a major performance enhancement to the field-proven Stalker Block 30. Through a series of subsystem upgrades, Redwire has doubled the flight endurance and payload capacity of the base Stalker system, closing the gap between the capabilities of sUAS and large UAS. With the flexibility and adaptability to host a wide variety of configurations, the Stalker Block 40 should not only meet the demanding mission challenges currently faced by today’s UAS but anticipates potential issues facing the battlefields of the future.
The Penguin C Mk2 is a long-endurance, long-range UAS designed for demanding operations, with endurance of up to 25 hours (payload dependent) and a line-of-sight range of 180km. The Penguin C Mk2 is designed to be modular, and can be adapted to meet multiple mission needs with a wide variety of payloads (e.g., when equipped with advanced Electro-Optical/Infrared (“EO/IR”) payloads, the Penguin C Mk2 delivers long-rang surveillance solutions under even the most challenging of circumstances). Real-time or near real-time visual communications allow decision-makers a situational awareness advantage while keeping operators out of harm’s way. Selected heritage for the Penguin C Mk2 includes the Ukraine Armed Forces, Latvia Ministry of Defense, and commercial operations, among others.
As a fully-automated, long-endurance UAS, the Penguin C VTOL has the ability to take off and land anywhere, which enables rapid deployment to support critical missions, even when the environment is harsh or contested. Modular and adaptable, the Penguin C VTOL meets a variety of mission needs with a wide range of payload options (e.g., when equipped with advanced EO/IR payloads, the Penguin C VTOL is well-equipped to perform observation, inspection, and surveillance tasks such as day and nighttime object tracking and small moving target indication). Selected heritage for the Penguin C VTOL includes the Latvia Ministry of Defense, Lithuania Ministry of Defense, and Royal Saudi Air Force, among others.
Sensors and Payloads
Our sensor and payload offerings support multi-domain missions ranging from airborne intelligence, surveillance, and reconnaissance (“ISR”) to space-based guidance, navigation, and control (“GN&C”) systems.
Redwire is the OEM for the Octopus line of ISR and optical gimbal camera payloads for airborne applications. These optronic surveillance systems are developed for either crewed or uncrewed systems and offer robust capabilities across missions and vehicles. Designed to face harsh conditions, Octopus payloads are ruggedized with an advanced magnesium structure assembled in a protected, fully sealed, dry gas environment. Operators using Octopus payloads receive accurate information through onboard data enhancement including overlays, digital zoom, and recording. A stabilized picture is crucial to providing accurate data, and our systems come pre-installed with software stabilization and roll correction, ensuring high-definition imagery that is normally reserved for much larger, heavier, and more expensive gimbals requiring a larger and more expensive aircraft.
Satellites that go into orbit generally require sensors and avionics systems. Redwire has developed advanced capabilities in these critical subsectors of the space supply chain with more than 50 years of on-orbit heritage. We provide a variety of space-qualified sensors and avionics systems, including a comprehensive range of sensors, such as star trackers and sun sensors that are critical for accurate navigation and control of spacecraft and camera systems. We specialize in core avionics, such as scalable power distribution, radio frequency front ends, and on-board computing capabilities, with an emphasis on reliability, quality, and radiation tolerance. These specialized avionics and sensors can be applied across multiple space environments, including LEO, GEO, Cis-lunar, and deep space missions.
Spacecraft payloads are the set of instruments that perform the satellite’s primary mission such as sensing, imaging, and communication. Redwire is engaged in payloads for infrared imaging, space situational awareness, positioning, navigation and timing (“PNT”), and radio frequency (“RF”) communications. RF communications systems are used as a primary payload, such as a link in a communications chain; to transport data to ground from other key sensor payloads; a primary sensor by sensing the emissions from other users; or as a secondary payload in order to transmit and receive key spacecraft telemetry and control signals. These systems support a variety of satellite applications, including encrypted tactical communications, signal detection and positioning. We have also invested in an RF testing capability that was custom tailored to the specific needs of small satellite communications and sensor payloads in proliferated LEO.
One example of an operationally-fielded Redwire payload is a Link-16 compatible RF system which successfully demonstrated the first-ever transmission of a Link-16 signal from space to ground. Such antennas are used as part of a multi-domain network employed by the North Atlantic Treaty Organization (“NATO”) members and other nations, which can be used to facilitate the exchange of jam-resistant, encrypted tactical data from space in near-real time between military aircraft, ships and ground forces. Link-16 antennas, including ours, are critical to U.S. commercial and defense applications with specialized applications focused on serving environments that have historically been difficult to close beyond line-of-sight links. Redwire is also delivering multiple advanced RF payloads for a constellation of satellites for a national security satellite constellation in LEO.
Backlog
We view growth in backlog as a key measure of our business development. As of December 31, 2025, our total contracted backlog was $411.2 million of which $299.8 million related to the Space segment and $111.4 million related to the Defense Tech segment. Contracted backlog represents the estimated dollar value of firm funded executed contracts for which work has not been performed (also known as the remaining performance obligations on a contract). For further information, refer to “Backlog” in Item 7. “Management’s Discussion and Analysis of Financial Condition and Results of Operations”.
Seasonality
No material portion of our business is considered to be seasonal. Various factors can affect the distribution of our revenue between accounting periods, including the timing of contract awards and the timing and availability of customer funding, as well as the timing of product deliveries and customer acceptance.
Customers and Strategic Partnerships / Relationships
Our product offerings are designed to meet the needs of a wide variety of national security, civil, and commercial public and private entities operating across aerospace and defense. Redwire supplies a wide variety of technologies in support of U.S. and allied countries’ multi-domain national security objectives and performs either directly or through large prime contractors for many U.S. national security agencies, including but not limited to, the U.S. Army, U.S. Marine Corps, U.S. Air Force, U.S. Space Force, DARPA, the National Reconnaissance Office (“NRO”), and allied national security agencies.
Civil customers are generally governmental entities that are not funded by defense budgets. Redwire performs either directly or through large prime contractors for civil agencies, including but not limited to NASA, ESA, and European national space agencies.
Finally, we deliver capabilities to various commercial space companies, satellite manufacturers, energy and infrastructure companies. Our broad and innovative technology portfolio of core offerings enables us to be a natural supply chain partner with components, systems and payloads. We have formalized contracts and strategic partnerships with a wide variety of customers, and we plan to continue pursuing additional agreements and partnerships.
During our fiscal year ended December 31, 2025, we generated 46.9% of our revenue from national security customers, 21.6% of our revenue from civil customers, and 31.5% of our revenue from commercial customers. For the same period, revenues from customers located outside of the United States accounted for 41.6%.
Customer Concentration
Refer to Note P – Revenues of the accompanying notes to the consolidated financial statements for further information on sales by major customers and location.
Competition
Redwire operates in competitive market segments that are sensitive to technological advances. We generally encounter highly diverse competition to win contracts from other firms, including lower and mid-tier federal contractors with specialized capabilities and large defense contractors with broad capabilities. In each of our market segments, some of our competitors are larger than Redwire and can maintain higher levels of expenditures for research and development. As such, we concentrate on the opportunities we believe are compatible with our resources, overall technological capabilities and objectives. Principal competitive factors in these market segments are product quality and reliability; technological capabilities, including reliable, resilient and innovative multi-domain offerings; service; past performance; ability to develop and implement complex, integrated solutions; ability to meet delivery schedules; and cost-effectiveness. We believe that we compete favorably on the basis of these factors.
We frequently “partner” or are involved in subcontracting and teaming relationships with companies that are, from time to time, competitors on other programs. We compete domestically and internationally against space systems components providers, including Airbus, Sodern, Rocket Lab USA, Inc. (a segment of Rocket Labs), UAS providers, including AeroVironment, Inc., Insitu, A Boeing Company, and Shield AI; and in some instances against larger companies such as Anduril Industries and Northrop Grumman. As a result of our M&A strategy, the Company’s total accessible market has evolved over time and changed our competitive platform, which has historically included non-traditional aerospace and defense contractors and occasionally large aerospace and defense companies. Our customers could decide to pursue one or more of our product development areas as a core competency and insource that technology development and production rather than purchase that capability from us as a supplier. This competition could result in fewer customer orders and a loss of market share.
In addition, some of our foreign competitors currently benefit from, and others may benefit in the future from, protective measures by their home countries where governments are providing financial support, including significant investments in the development of new technologies. Government support of this nature greatly reduces the commercial risks associated with space technology development activities for these competitors. This market dynamic may result in increased pricing pressure and impact other competitive factors.
Resources
Research and Development
Redwire’s business strategy is dependent on technological advancements that support our existing and future space and defense technology offerings. As a result, through internally and externally funded research and development projects, we invest in the strategic focus areas outlined above with particular emphasis on areas of significant growth and long-term opportunity. Looking forward, we expect to continue this investment into the areas we believe offer the greatest opportunities for sustained growth and profitability.
We conduct research and development principally in the U.S. and Europe. Research and development expenses were $19.8 million for the year ended December 31, 2025.
Intellectual Property
We own a substantial intellectual property portfolio that includes many U.S. and foreign patents, as well as many U.S. trademarks, domain names, and copyrights. We actively pursue internal development of intellectual property. In addition to our patent portfolio, we own other intellectual property such as unpatented trade secrets, subject matter expertise, data and software. Additionally, we rely on licenses of certain intellectual property to conduct our business operations, including certain proprietary rights licensed to and from third parties. While our intellectual property rights in the aggregate are important to our operations, we do not believe any particular trade secret, patent, trademark, copyright, license, or other intellectual property right is of such importance that its loss, expiration or termination would have a material effect on our business.
Raw Materials and Suppliers
In manufacturing our products, we use our own production capabilities as well as a base of third-party suppliers and subcontractors. Certain aspects of our manufacturing activities require relatively scarce raw materials; occasionally, we have experienced difficulty in our ability to procure raw materials, components, sub-assemblies, and other supplies required in our manufacturing process.
Regulatory
Federal Communications Commission
The regulations, policies and guidance issued by the Federal Communications Commission (“FCC”) apply to the operation of our spacecraft and certain sUAS platforms. When we communicate with our spacecraft using any part of the electromagnetic spectrum, we are operating a space station to which FCC regulations apply. Similarly, certain of our sUAS operations require FCC authorization for radio frequency communications and command and control links. Operators of regulated space stations and sUAS platforms are required to hold and maintain compliance with proper licenses throughout the duration of any given mission.
In late 2025, the FCC issued a Notice of Proposed Rulemaking, titled "Space Modernization for the 21st Century," which proposes to replace the existing Part 25 satellite licensing framework with a new Part 100. This overhaul seeks to implement a "modular" licensing process and performance-based standards that may apply to our future spacecraft and orbital activities. Additionally, these proposed rules include new operational, technical, and financial requirements such as updated surety bond structures and space situational awareness data sharing for all commercial space operators and sUAS communications systems subject to U.S. jurisdiction. If finalized, these rules could require changes to our system designs and increase compliance costs in order to secure or maintain spectrum licensure for both spacecraft and sUAS platforms.
National Oceanic and Atmospheric Administration
Redwire spacecraft operate with space-qualified photographic equipment installed. While primarily intended to function as mission assurance tools, these cameras are capable of capturing incidental Earth imagery while in orbit. As such, these cameras are subject to the licensing requirements and regulations of National Oceanic and Atmospheric Association’s (“NOAA") Commercial Report Sensing Regulatory Affairs (“CRSRA”) office.
The Federal Aviation Administration
As a participant in launch activities, we are indirectly subject to the license requirements of the Federal Aviation Administration’s (“FAA”) Office of Commercial Space Transportation (“AST”). The FAA regulates the airspace of the United States, through which launch vehicles must fly during launch to orbit. The AST office predominantly processes launch license requests submitted by launch vehicle operators, which include information on the constituent payloads flying on any given mission. As a result, reviews of our payloads by AST will occur before or during, for example, the processing of a launch vehicle provider launch license.
Export Controls
Our orbital infrastructure business is subject to, and we must comply with, stringent U.S. and international import and export control laws, including the International Traffic in Arms Regulations (“ITAR”), Export Administration Regulations (“EAR”) of the Bureau of Industry and Security of the U.S. Department of Commerce, and the European Union (“EU”) export controls. The ITAR generally restricts the export of hardware, software, technical data and services that have defense or strategic applications. The EAR and EU export controls similarly regulate the export of hardware, software and technology that has commercial or “dual-use” applications (i.e., for both military and commercial applications) or that have less sensitive military or space-related applications that are not subject to the ITAR. The regulations exist to advance the national security and foreign policy interests of the U.S. and EU, as applicable.
Human Capital
We strive to be the employer of choice in the space and defense community. As of December 31, 2025, we had approximately 1,410 employees based primarily in the U.S. and Europe.
We are committed to technical excellence and mission success which is reinforced by our core values:
•Integrity: We stand for honesty, fairness, and commitment in all that we do, and an uncompromising adherence to ethical behavior.
•Innovation: We are change agents. We find new ways to solve our customers’ most challenging problems. Our thought leadership will create new opportunities for better ways to accomplish our goals.
•Impact: We will have a positive impact on our industry, community, nation and humanity. We focus on solving important problems that will shape future outcomes in a positive way.
•Inclusion: We believe in the value of diverse perspectives. Individuals from all backgrounds, experiences and skill sets are needed to make Redwire successful. We value each other.
•Excellence: We are focused professionals who are committed to delivering results.
We have an experienced talent acquisition team and our recruitment efforts are focused on hiring experienced talent in space and defense technology who are attracted to Redwire’s core values. As we continue to grow, we are increasing our recruiting capacity by utilizing AI sourcing tools, and enhancing internal incentives for recruitment.
Redwire is committed to recruiting, retaining and promoting a high-performing workforce. We strive to offer competitive salaries and benefits. Management monitors the changing labor conditions at national and local levels and adjusts compensation packages in order to attract and retain high-performing individuals. The Company offers short- and long-term incentive programs, retirement and healthcare benefits, flexible paid time off, and employee assistance programs. The Company’s incentive programs are intended to motivate and reward strong performance.
History
Redwire was founded in 2020 by private equity firm AE Industrial Partners Fund II, LP (“AEI”), but the heritage of the various businesses that were brought together to form Redwire stretches back decades. In 2021, the Company completed a series of mergers and business combinations with Genesis Park Acquisition Corp. (“GPAC”). For accounting purposes, the transaction was treated as a reverse recapitalization and GPAC was treated as the acquired company. GPAC was renamed Redwire Corporation and became the surviving public company.
The Company has grown organically while also continuing to integrate several acquisitions from a fragmented landscape of space and defense focused technology companies with innovative capabilities and deep flight heritage. Strategic acquisitions that augment our core value drivers are a key part of our growth strategy. We have completed eleven acquisitions since March 2020, which collectively have provided us with a broad portfolio of complementary technologies and solutions to serve our target market segments and customers. These acquisitions include:
•2020 – Acquired Redwire Space Components, LLC (f/k/a Adcole Space, LLC), Redwire Space Sensors, Inc. (f/k/a Deep Space Systems, Inc.), In Space Group, Inc. and its subsidiaries, Redwire Space, Inc. (f/k/a Made In Space, Inc.) and Made in Space Europe S.a.r.l (collectively “MIS”), Redwire Space Solutions, LLC (f/k/a Roccor, LLC), and LoadPath, LLC.
•2021 – Acquired Redwire Space Missions LLC (f/k/a Oakman Aerospace, LLC), Redwire Space Enterprises, Inc. (f/k/a Deployable Space Systems, Inc.), and Redwire Space Technologies, Inc. (f/k/a Techshot, Inc.).
•2022 – Acquired Redwire Space NV (f/k/a Qinetiq Space NV), (“Space NV”).
•2024 – Acquired Hera Systems, Inc. (“Hera Systems”) and formed Redwire Poland sp. z.o.o.
•2025 – Acquired Redwire Defense Tech Intermediate Holdings, LLC and its subsidiaries (f/k/a Edge Autonomy Intermediate Holdings, LLC) (“Edge Autonomy”) and formed Space Microgravity Development LLC (“SpaceMD”) and Redwire Defense Tech UK, Ltd.
From time to time, the Company will acquire or dispose of businesses and realign contracts, programs, or businesses among and within our organization. These realignments are typically designed to leverage existing capabilities more fully and to enhance efficient development and delivery of our core space and defense technology offerings.
Available Information
Copies of our Annual Report on Form 10-K, Quarterly Reports on Form 10-Q, Current Reports on Form 8-K, and amendments to these reports filed or furnished pursuant to Section 13(a) or 15(d) of the Securities Exchange Act of 1934, as amended (the “Exchange Act”) are available free of charge through our website (www.rdw.com) as soon as reasonably practicable after we electronically file the material with, or furnish it to, the SEC. Additionally, we use our website as a channel of distribution for important Company information. We routinely post important information on our website, including press releases, investor presentations and financial information, which may be accessed by clicking on the Investors section of our website at www.rdw.com. We also use our website to expedite public access to time-critical information regarding our Company in advance of or in lieu of distributing a press release or a filing with the SEC disclosing the same information. Therefore, investors should look to the Investors section of our website for important and time-critical information. The information contained on the Company’s website is not included in, nor incorporated by reference into, this Annual Report on Form 10-K.
Item 1A. Risk Factors
Readers should carefully consider the following risk factors, together with all of the other information included in this Annual Report on Form 10-K. The risks and uncertainties described herein may not be the only ones facing the Company and are not organized in order of priority. Additional risks and uncertainties not presently known to management or that management currently believes to be immaterial may also adversely affect the Company’s business. If any of the following risks and uncertainties develop into actual events, it could affect the Company’s business, financial condition, or results of operations, cause the trading price of the Company’s common stock to decline, or cause actual results to differ materially from those expected.
Risk Factors Summary
Some of the principal risks that may impact our business and results of operations are listed below:
Business and Industry Risks
•our results could be affected by economic uncertainty, including high inflation, market volatility, and the potential worsening of macro-economic conditions;
•geopolitical and macroeconomic events and conditions could adversely affect our business, financial condition and operating results;
•tariffs may adversely affect demand for our products and services, and increase our manufacturing costs;
•the failure of financial institutions or transactional counterparties could adversely affect our current and projected business operations and our financial condition and results of operations;
•we operate in evolving industries, have a limited operating history since our acquisition of Edge Autonomy and have a history of losses to date, which makes it difficult to evaluate our future prospects and the risks and challenges we may encounter;
•if we are unable to successfully integrate recently completed and future acquisitions, including the recent acquisition of Edge Autonomy or successfully select, execute or integrate future acquisitions into the business and realize anticipated synergies and benefits or do so within the expected timeframe, our operations and financial condition could be materially and adversely affected;
•our ability to grow our business depends on the successful development and continued refinement of our proprietary technologies, products, and service offerings;
•competition with existing or new companies could cause downward pressure on prices, fewer customer orders, reduced margins, the inability to take advantage of new business opportunities, and the loss of market share;
•a limited number of customers make up a high percentage of our revenue;
•we may become involved in litigation from time to time that may materially adversely affect us;
•natural disasters, geopolitical conflicts, or other natural or man-made catastrophic events could disrupt and impact our business;
•adverse publicity stemming from any incident involving Redwire or our competitors could have a material adverse effect on our business, financial condition and results of operations;
•our business involves significant risks and uncertainties that may not be covered by insurance or indemnity;
•our business could be seriously harmed if we fail to respond to commercial industry cycles in terms of our cost structure, manufacturing capacity, and/or personnel needs;
•customers are unwilling to adopt our core offerings;
•any delays in the development, design, engineering and manufacturing of our core offerings may adversely impact our business, financial condition and results of operations;
•unsatisfactory performance of our core offerings could have a material adverse effect on our business, financial condition and results of operations;
•our results of operations and cash flows are substantially affected by our mix of fixed-price, cost-plus and time-and-material type contracts;
•our cash flow and profitability could be reduced if expenditures are incurred prior to the final receipt of a contract;
•we may in the future invest significant resources in developing new offerings and exploring the application of our technologies for other uses and those opportunities may never materialize;
•we may not be able to convert our orders in backlog into revenue;
•we have and in the future may continue to use AI in our business, and challenges with properly managing its use could result in reputational harm, competitive harm, and legal liability, and adversely affect our business, financial condition and results of operations;
•our reliance on third-party launch vehicles to launch our spacecraft and customer payloads into space;
•we may experience a total loss of our technology and products and our customers’ payloads, if there is an accident on launch or during the journey into space;
•our operating results may fluctuate significantly, which makes our future operating results difficult to predict and could cause our operating results to fall below expectations or any guidance that we may provide;
•our margins and operating results may suffer if we experience unfavorable changes in the proportion of cost-plus-fee or fixed-price contracts in our total contract mix;
•our systems, products, technologies and services and related equipment may have shorter useful lives than we anticipate;
•cyber-attacks and other security threats and disruptions could have a material adverse effect on our business, financial condition and results of operations;
•our business, financial condition and results of operations are subject to risks resulting from broader geographic operations;
•our net earnings and our net assets could be materially affected by an impairment of goodwill;
•our ability to use net operating loss carryforwards and certain other tax attributes may be limited;
Government Contract Risks
•we are subject to the requirements of the National Industrial Security Program Operating Manual (“NISPOM”) for our facility security clearance, which is a prerequisite to our ability to perform on classified contracts for the U.S. government;
•the U.S. government’s budget deficit and the national debt, as well as any inability of the U.S. government to complete its budget process for any government fiscal year and any resulting future government shutdowns, could have an adverse impact on our business;
•we depend significantly on U.S. government contracts, which often are only partially funded, subject to immediate termination, and heavily regulated and audited;
•disputes with our subcontractors or the inability of our subcontractors to perform, or our key suppliers to timely deliver our components, parts or services, could cause our core offerings to be produced or delivered in an untimely or unsatisfactory manner;
Regulatory Risks
•investments in us may be subject to U.S. foreign investment regulations, which may impose conditions on or limit certain investors’ ability to purchase our common stock, potentially making our common stock less attractive to investors;
•we are subject to stringent U.S. economic sanctions, and trade control laws and regulations, as well as risks related to doing business in other countries, including those related to tariffs, trade restrictions and government actions;
•our business is subject to a wide variety of additional extensive and evolving government laws and regulations and failure to comply with such laws and regulations could have a material adverse effect on our business;
•our reputation and ability to do business may be impacted by the improper conduct of our employees, agents or business partners;
•failure to comply with federal, state and foreign laws and regulations relating to privacy, data protection and consumer protection, or the expansion of current or the enactment of new laws or regulations relating to privacy, data protection and consumer protection, could adversely affect our business and our financial condition;
•we are subject to environmental regulation and may incur substantial costs;
•changes in tax laws or regulations may increase tax uncertainty and adversely affect results of our operations and our effective tax rate;
•if we fail to adequately protect our intellectual property rights or defend against intellectual property claims, our competitive position could be impaired and our intellectual property applications for registration may not be issued or be registered;
•our technology may violate the proprietary rights of third parties, which could have a negative impact on our operations;
Risks Related to Financing and the Ownership of our Securities
•we may require substantial additional funding to finance our operations, but adequate additional financing may not be available when we need it, on acceptable terms or at all;
•the acquisition of Edge Autonomy (the “Edge Acquisition”) and issuance and sale of shares of our Series A Convertible Preferred Stock has reduced the relative voting power of holders of our common stock and diluted the ownership of holders of our capital stock;
•AEI holds a majority of the voting power of our Board of Directors (the “Board”) and has significant influence over us, which could limit other investors’ ability to influence the outcome of key transactions;
•provisions in the Certificate of Designation related to our Series A Convertible Preferred Stock may delay or prevent our acquisition by a third party, which could also reduce the market price of our capital stock;
•our Series A Convertible Preferred Stock has rights, preferences and privileges that are not held by, and are preferential to, the rights of holders of our other outstanding capital stock;
•there may be sales of a substantial amount of our common stock by our current shareholders and these sales could cause the price of our common stock to fall;
Risks Related to Being a Public Company
•we may not be able to remain in compliance with the continued listing requirements of the NYSE
•we may issue additional common stock or other equity securities which could dilute our shareholders’ ownership interests;
•the trading price of our common stock is and may continue to be volatile; and
•we have identified material weaknesses in internal control over reporting. If we were to identify additional material weaknesses or other deficiencies, or otherwise fail to maintain effective internal control over financial reporting, we may not be able to accurately and timely report our financial results, in which case our business may be harmed and investors may lose confidence in the accuracy and completeness of our financial reports.
Risks Relating to the Company’s Business and Industry
Our results could be affected by economic uncertainty, an economic slowdown or a recession.
Heightened levels of inflation, market volatility and the potential worsening of macro-economic conditions, including slower growth or recession, changes to fiscal and monetary policy, high unemployment, tighter credit, higher interest rates and currency fluctuations, present a risk for us, our suppliers and the stability of our suppliers. Concerns about the systemic impact of a potential widespread recession (in the U.S. or internationally) or geopolitical issues have, in the past, led to increased market volatility and diminished growth expectations in the U.S. economy and abroad and may continue to do so in the future. The foregoing factors have affected, and may continue to affect, the Company’s cost of capital, financial condition and results of operations. Decreases in the availability and cost of supplies have caused, and may continue to cause, stress in our domestic and foreign supplier base and have resulted, and may continue to result, in shortages and delays for the procurement of materials, components and other supplies required for the Company’s products. The macroeconomic environment has also impacted the cost and schedule of numerous programs in our existing backlog resulting in program execution delays and may continue to do so in the future. These delays and the timing of new awards can impact our earnings and cash flows. Although we believe spending in the space and defense industry is more resilient to adverse macro-economic conditions than many other industrial sectors, our suppliers and other partners, many of which are more exposed to commercial markets, may be adversely impacted by an economic downturn, which could affect their performance and adversely impact our operations. In addition, macroeconomic conditions could cause budgetary pressures for our government customers resulting in reductions or delays in spending, which could adversely impact our business. A reduction in spending by either government or commercial customers could, in addition to impacting our revenues, affect our ability to raise additional capital when needed on favorable terms or at all. As such, if economic conditions worsen or a recession occurs, our business, operations and financial results could be materially adversely affected.
As it relates to our international operations in Europe, the Company has foreign currency translation exposure between the euro and U.S. dollar as our results are expressed in U.S. dollars, which may impact our revenues, expenses and cash flows.
Geopolitical and macroeconomic events and conditions could adversely affect our business, financial condition and operating results.
Our international business is affected by changes in U.S. and non-U.S. national policies and priorities, and geopolitical relationships, any of which may be influenced by changes in the global threat environment, political leadership, geopolitical and economic uncertainties, war and terrorist events, the escalation or continuation of armed conflict, government budgets, inflationary pressures, sanctions imposed in countries where we do business or seek to do business, and economic and political factors more generally.
Unsatisfactory performance of our products resulting from the environments in which our space systems, UAS, spacecraft components, space data applications and drones operate, including in combat or other areas where wars and hostilities may occur (for example, the war in Ukraine), may cause the demand for the products and technologies offered by us to decline or be subject to variation. In particular, approximately 3% of our sales for the year ended December 31, 2025 were related to Ukraine, which sales have been declining and may continue to decline in the event that the war and hostilities in Ukraine end, decline or change, or as a result of changes in international support for military assistance to Ukraine.
Further, there is a possibility that political decisions made by the U.S. government, such as changes in prior military commitments, including in response to the armed conflict in Ukraine or the Middle East, or an impasse on policy issues, could impact future spending and program authorizations, which may not increase or may decrease or shift to programs in areas in which we do not provide products or services or are less likely to be awarded contracts. Such changes in spending authorizations and budgetary priorities may occur as a result of shifts in spending priorities from defense-related and other programs due to, among other factors, competing demands for federal funds and the number and intensity of military conflicts, all of which may ultimately have a materially adverse effect on our business operation and financial results.
Recent tariff actions by the United States and other countries may adversely affect demand for our products and services, as well as increase manufacturing costs, which could have a material adverse effect on our business, financial condition and results of operations.
The current U.S. administration issued tariff actions on imports from a broad set of countries, including Canada, Mexico, European Union member states, Japan and China. The effects of these tariffs cannot be predicted with certainty but there is a likelihood that they will create increased supply chain costs for certain inputs to the manufacture of our products and potentially cause shortages of certain raw materials or supplied components. In response to these tariffs, U.S. trading partners have imposed, or are likely to impose, their
own tariffs, which could have the effect of increasing the cost of our products and services that are sold to or in foreign countries. In addition, many economists and other market experts have indicated an increased likelihood of global recession as a result of the potential disruption to international trade.
Although a majority of Redwire’s historical sales were to domestic customers and a significant portion of Edge Autonomy’s historical sales to non-U.S. customers were supplied from its factory in Europe, which should mitigate the effects of tariff actions on such sales, foreign sales have and may continue to represent a significant portion of our total revenues. Accordingly, these trade actions and the widespread uncertainty and international tensions resulting therefrom, including, without limitation, the effect on the value of the U.S. dollar relative to other currencies, may adversely affect revenues, costs of sales and production volumes, any of which could materially and adversely harm our business, financial condition and results of operations.
The failure of financial institutions or transactional counterparties could adversely affect our current and projected business operations and our financial condition and results of operations.
We regularly maintain cash balances with financial institutions in excess of the FDIC insurance limit. A failure of a depository institution to return deposits could impact access to our invested cash or cash equivalents and could adversely impact our operating liquidity and financial performance. Similarly, if our customers or suppliers experience liquidity issues as a result of financial institution defaults or non-performance where they hold cash assets, their ability to pay us or provide necessary supplies may become impaired and could have a material adverse effect on our results of operations, including the collection of accounts receivable and cash flows.
Additionally, future adverse developments with respect to specific financial institutions or the broader financial services industry may lead to market-wide liquidity shortages, impair the ability of companies to access near-term working capital needs, and create additional market and economic uncertainty. There can be no assurance that future credit and financial market instability and a deterioration in confidence in economic conditions will not occur. Our general business strategy, including our ability to access existing debt under the terms of our Adams Street and JPMorgan credit agreements, may be adversely affected by any such economic downturn, liquidity shortages, volatile business environment or continued unpredictable and unstable market conditions. The tightening of credit in financial markets inside and outside of the U.S. could adversely affect the ability of our customers and suppliers to obtain financing and could result in a decrease in or cancellation of orders for our products and services or impact the ability of our customers to make payments.
If the current equity and credit markets deteriorate, or if adverse developments are experienced by financial institutions, it may cause short-term liquidity risk and also make any necessary debt or equity financing more difficult, more costly, and more dilutive. Failure to secure any necessary financing in a timely manner and on favorable terms could have a material adverse effect on our growth strategy, financial performance and stock price and could require us to alter our operating plans.
We operate in evolving industries, have a limited operating history since our acquisition of Edge Autonomy and have a history of losses to date, which makes it difficult to forecast our revenue, plan our expenses and evaluate our business and future prospects.
We operate in rapidly evolving industries that may not develop in a manner favorable to our business and we have operated for a limited period of time since our significant acquisition of Edge Autonomy and entry into the uncrewed aircraft systems (“UAS”) and autonomous technology solutions sector. While our business has grown rapidly, and much of that growth has occurred in recent periods, including as a result of our acquisition of Edge Autonomy, space systems, UAS, spacecraft components and space data applications may not continue to develop in a manner that we expect or that otherwise would be favorable to our business. Although we are focused on achieving profitability, there are no assurances we will be able to meet our goals or be able to achieve and sustain profitability in future periods. As a result of our limited operating history since our acquisition of Edge Autonomy and recent entry into the UAS and autonomous technology solutions sector, history of operating losses and ongoing changes in our new and evolving industries, including evolving demand for our core offerings, our ability to forecast our future results of operations and plan for and model future growth is limited and subject to a number of uncertainties. We have encountered and expect to continue to encounter risks and uncertainties frequently experienced by growing companies in rapidly evolving industries, such as the risks and uncertainties described herein. Accordingly, we may be unable to prepare accurate internal financial forecasts or replace anticipated revenue that we do not receive as a result of delays arising from these factors, and our results of operations in future reporting periods may be below the expectations of investors or analysts. If we do not address these risks successfully, our results of operations could differ materially from our estimates and forecasts or the expectations of investors or analysts, causing our business to suffer and our common stock price to decline.
As part of growing our business, we have made and may continue to make acquisitions. Any acquisitions, partnerships or joint ventures into which we enter, including our acquisition of Edge Autonomy, could disrupt our operations and have a material adverse effect on our business, financial condition and results of operations.
From time to time, we may evaluate potential strategic acquisitions of businesses, including partnerships or joint ventures with third parties, to add new products and technologies, acquire talent, grow new sales channels or enter into new markets or sales territories.
We may not be successful in identifying acquisition, partnership and joint venture candidates. We may also participate in partnerships or joint ventures as a result of acquisitions.
In addition to possible shareholder approval, we may need approvals and licenses from relevant government authorities for the acquisitions to comply with applicable laws and regulations, and a failure to obtain such approvals and licenses could result in delays in completing an acquisition and increased costs, and may disrupt our business strategy. Furthermore, acquisitions, such as our acquisition of Edge Autonomy, require significant attention from our management and could result in a diversion of resources from our existing business, which in turn could have an adverse effect on our operations. The acquisition of Edge Autonomy or any other assets or businesses acquired in the future may not generate the financial results we expect. Acquisitions could result in the use of substantial amounts of cash, potentially dilutive issuances of equity securities and potential exposure to unknown liabilities of the acquired business. Moreover, the costs of identifying and consummating acquisitions may be significant.
We may be unable to successfully integrate our operations with the acquired company, including Edge Autonomy, and realize the anticipated synergies and other benefits of the acquisition, or we may be unable to do so within the anticipated timeframe.
Acquisitions, such as our acquisition of Edge Autonomy, and the subsequent integration of new assets, businesses, key personnel, customers, vendors and suppliers may require significant costs and attention from our management. For example, our acquisition of Edge Autonomy involved the combination of two companies which previously operated independently. While we expect to benefit from certain synergies in connection with acquisitions, such as our acquisition of Edge Autonomy, and the elimination of duplicative costs associated with general and administrative expenses, among others. we will, however, be required to devote significant management attention and resources to integrating the business practices, cultures and operations of the target company, including Edge Autonomy, with ours. Potential difficulties we may encounter in the integration process of Edge Autonomy and any future acquisitions include, among others, the following:
•the inability to successfully combine our operations in a manner that permits us to achieve the cost savings from the acquisition, or results in the anticipated benefits and synergies of the acquisition not being realized in the timeframe currently anticipated or at all;
•the inability to integrate product lines and capitalize on cross-selling opportunities;
•the inability to resolve potential conflicts that may arise relating to customer, supplier and other important relationships of our businesses;
•potential unknown liabilities and unforeseen increased expenses, delays or regulatory conditions associated with the acquisition;
•failure to retain key management and other key employees of the target company;
•the potential need to upgrade the target company’s reporting systems, including internal controls over financial reporting and/or systems, which may be found to have material weaknesses or significant deficiencies;
•the difficulties harmonizing differences in the business cultures;
•failure to continue the operational success of the businesses we acquire or successfully finance or integrate such businesses or the businesses with which we form a partnership or joint venture;
•the challenge of managing the expanded operations of a significantly larger and more complex company and coordinating geographically separate organizations; and
•additional complexities of combining two companies with different histories, organizations, systems, operating procedures, compliance programs, products, markets, customers, technology, networks and other assets.
For the foregoing reasons, it is possible that the integration process, including our integration of Edge Autonomy, could result in the distraction of our management, the disruption of our ongoing business or inconsistencies in our operations, services, standards, controls, procedures and policies, any of which could adversely affect our ability to maintain relationships with customers, vendors and employees or to achieve the anticipated benefits of the acquisition, or could otherwise adversely affect our business and financial results. In addition, we may have potential write-offs of acquired assets and/or an impairment of any goodwill recorded as a result of such acquisitions or participations. Any acquisition, partnership or joint venture may not be successful, may reduce our cash reserves, may negatively affect our earnings and financial performance and, to the extent financed with the proceeds of debt, may increase our indebtedness. Further, depending on market conditions, investor perceptions of the Company and other factors, we might not be able to obtain financing on acceptable terms, or at all, to implement any such transaction. We cannot ensure that any acquisition, partnership or joint venture we make will not have a material adverse effect on our business, financial condition and results of operations.
We expect to incur substantial expenses related to our acquisition of Edge Autonomy, including with respect to integration.
We expect to incur substantial expenses in integrating the business, operations, systems, technologies, policies and procedures of Edge Autonomy with ours. While we have assumed that a certain level of expenses would be incurred, there are a number of factors beyond
our control that could affect the total amount or the timing of the expenses relating to the integration of Edge Autonomy’s operations. Many of the expenses that will be incurred, by their nature, are difficult to estimate accurately at the present time. As a result, the expenses associated with the Edge Acquisition could, particularly in the near term, reduce the savings that we expect to achieve from the elimination of duplicative expenses and the realization of economies of scale and cost savings following the completion of the Edge Acquisition, and impact our business and operations and the market price of our common stock.
The market price of our common stock may decline as a result of the Edge Acquisition.
The market price of our common stock may decline as a result of the Edge Acquisition if (a) we do not achieve the perceived benefits of the Edge Acquisition as rapidly or to the extent anticipated by financial or industry analysts, or (b) the effect of the Edge Acquisition on our financial results is not consistent with the expectations of financial or industry analysts. Our stockholders prior to the Edge Acquisition may not wish to continue to invest in the Company, or for other reasons may wish to dispose of some or all of their shares of our common stock. In addition, the expiration of the lock-up set forth in the A&R Investor Rights Agreement (as defined below) may result in additional shares of our common stock being sold. If, following the closing of the Edge Acquisition, significant amounts of our common stock are sold, the price of our common stock could decline.
The historical consolidated financial information of Edge Autonomy and the unaudited pro forma information included in our filings with the SEC may not be a reliable indicator of future results.
We have no prior history as a combined company with Edge Autonomy and our assets and operations have not been managed on a combined basis. As a result, our unaudited pro forma condensed combined financial information, which was prepared in accordance with Article 11 of Regulation S-X, and historical financial statements of our and Edge Autonomy’s businesses provided in our filings with the SEC are not necessarily indicative of the financial position or results of operations that would have actually occurred had the Edge Acquisition not been completed at or as of the dates indicated, nor is it indicative of the future operating results or financial position of the combined Company.
Our unaudited pro forma condensed combined financial information does not reflect any cost savings, operating synergies or revenue enhancements that the combined Company may achieve as a result of the Edge Acquisition, nor does it reflect the costs to integrate the operations of Edge Autonomy or the costs necessary to achieve any cost savings, operating synergies and revenue enhancements. Our unaudited pro forma condensed combined financial information is based in part on certain assumptions regarding the Edge Acquisition. We believe the assumptions underlying such unaudited pro forma condensed combined financial information are reasonable under the circumstances, however, such assumptions and estimates are preliminary and may not prove to be accurate over time. In addition, if and to the extent there are any changes in market conditions affecting the Edge Acquisition, then the unaudited pro forma condensed combined financial information and the future operating results or financial position of the combined Company may be impacted, and such impact may be material. We have no obligation to update the unaudited pro forma condensed financial information for any subsequent event and may not do so.
As a result, investors should not place any undue reliance on our unaudited pro forma condensed combined financial information, and our actual results following the completion of the Edge Acquisition may differ from those that are anticipated.
Our ability to grow our business depends on the successful development and continued refinement of many of our proprietary technologies, products, and service offerings, which are subject to many uncertainties, some of which are beyond our control.
The market for our space and defense technology offerings is characterized by rapid change and technological improvements. These sectors have experienced significant growth driven by advancements in autonomous systems, AI, machine learning, and sensor technologies. The success of our business depends in part on effectively designing, producing and engineering developmental technologies related to our space and defense technology offerings. If for any reason we are unable to continue to manufacture, design and develop technologies as planned or provide the services and products that our customers expect from us, this could have a material adverse effect on our business, financial condition and results of operations. We have derived, and we expect to continue to derive, a substantial portion of our revenues from providing innovative products included in our space and defense technology offerings that are based upon today’s leading technologies and that are capable of adapting to future technologies. As a result, our success will depend, in part, on our ability to develop and market product and service offerings that respond in a timely manner to the technological advances of our customers, evolving industry standards and changing customer preferences. We may not be successful in identifying, developing and marketing products or systems that respond to rapid technological change, evolving technical standards and systems developed by others.
If our current or future core offerings do not meet expected performance or quality standards, including with respect to customer safety and satisfaction, this could cause operational delays. In addition, any delay in manufacturing new products as planned could increase costs and cause our core offerings to be less attractive to potential new customers. Further, certain government bodies may have priority with respect to the use of our core offerings for national defense reasons, which may impact our cadence of producing and selling our core offerings to other customers. Any production, operational or manufacturing delays or other unplanned changes to
our ability to design, develop and manufacture or offer our core offerings could have a material adverse effect on our business, financial condition and results of operations.
We believe that, in order to remain competitive in the future, we will need to continue to invest significant financial resources to develop new offerings and technologies or to adapt or modify our existing core offerings and technologies, including through internal research and development, acquisitions and joint ventures or other teaming arrangements. These expenditures could divert our attention and resources from other projects, and we cannot be sure that these expenditures will ultimately lead to the timely development of new offerings and technologies or identification of and expansion into new markets. Due to the design complexity of our offerings, we may, in the future, experience delays in completing the development and introduction of new offerings. Any delays could result in increased costs of development or deflect resources from other projects. In addition, there can be no assurance that the market for our core offerings will develop or continue to expand or that we will be successful in newly identified markets as we currently anticipate. Any failure to increase our revenue sufficiently to keep pace with our investments and other expenses could prevent us from maintaining or increasing profitability or positive cash flow. Furthermore, if our future growth and operating performance fail to meet investor or analyst expectations, or if we have future negative cash flow or losses resulting from expanding our operations, this could have a material adverse effect on our business, financial condition and results of operations. Additionally, we cannot be sure that our competitors will not develop competing technologies that gain market acceptance in advance of our offerings.
We also rely on our customers to fund/co-fund development of new offerings and technologies. If our customers reduce their investments, that may impact our ability to bring new offerings and technologies to market and/or increase the investment that is necessary for the Company to make in order to remain competitive, either of which could have a material adverse effect on our business, results of operations and financial condition.
Additionally, the possibility exists that our competitors might develop new technology or offerings that might cause our existing technology and core offerings to become obsolete. If we fail in our new offering development efforts or our core offerings fail to achieve market acceptance more rapidly as compared to our competitors, our ability to procure new contracts could be negatively impacted, which could negatively impact our results of operations and financial condition.
Competition from existing or new companies could cause us to experience downward pressure on prices, fewer customer orders, reduced margins, the inability to take advantage of new business opportunities, and the loss of market share.
We operate in competitive markets and generally encounter highly diverse competition to win contracts from other firms, including lower and mid-tier federal contractors with specialized capabilities, large defense contractors and the federal government. Additionally, our markets are facing increasing industry consolidation, resulting in larger competitors who have more market share putting more downward pressure on prices and offering a more robust portfolio of products and services. We are subject to competition based upon product design, performance, pricing, quality, and services. Our product performance, engineering expertise, and product quality have been important factors in our growth. While we try to maintain competitive pricing on those products that are directly comparable to products manufactured by others, in many instances our products will conform to more exacting specifications and carry a higher price than analogous products. Many of our customers and potential customers have the capacity to design and internally manufacture products that are similar to our core offerings. We face competition from research and product development groups and the manufacturing operations of current and potential customers, who continually evaluate the benefits of internal research, product development, and manufacturing versus outsourcing. Our customers could decide to pursue one or more of our product development areas as a core competency and insource that technology development and production rather than purchase that capability from us as a supplier. This competition could result in fewer customer orders and a loss of market share.
We compete domestically and internationally against space systems components providers and in some cases against large aerospace and defense companies. We may also face competition in the future from emerging low-cost competitors in Europe, India, Russia and China. Competition in our guidance, navigation and control business is highly diverse, and while our competitors offer different products, there is often competition for contracts that are part of governmental budgets. Additionally, as a result of the Edge Acquisition, we face competition from various entities, including established defense contractors, autonomous flight system specialists, security technology providers, and companies focused on sensor technology and AI software development, many of which are larger than us and have greater technical, manufacturing and financial resources. The product capabilities of consumer and commercially focused drone manufacturers continue to increase and their product prices remain low relative to existing defense solutions. This competition could affect our market position, as rapid technological advancements in AI and automation may require significant ongoing investment in research and development to maintain our competitive advantage. Failure to effectively compete in these areas could result in reduced sales, margin pressure, and loss of strategic opportunities.
In addition, some of our foreign competitors currently benefit from, and others may benefit in the future from, protective measures by their home countries where governments are providing financial support, including significant investments in the development of new technologies. Government support of this nature greatly reduces the commercial risks associated with space and UAS technology
development activities for these competitors. This market environment may result in increased pressures on our pricing and other competitive factors.
We believe our ability to compete successfully in designing, engineering and manufacturing our core offerings at significantly reduced cost to customers does and will depend on a number of factors, which may change in the future due to increased competition, our ability to meet our customers’ needs and the frequency and availability of our offerings. If we are unable to compete successfully, our business, financial condition and results of operations would be adversely affected.
A limited number of customers make up a high percentage of our revenue. If we cannot maintain these relationships, our future operating results will be adversely affected.
Revenues from our two largest customers were approximately 19% and 20% of our total revenues for the year ended December 31, 2025. The revenue attributable to our top customers has fluctuated in the past and may fluctuate in the future, which could have a material adverse effect on our business, financial condition, results of operations, cash flows and prospects. In addition, the termination of these relationships, including following any failure to renew a long-term contract, could result in a temporary or permanent loss of revenue.
We may become involved in litigation from time to time that may materially adversely affect us.
From time to time, we have become and may in the future be involved in legal proceedings relating to various matters, including intellectual property, commercial, employment, class action, whistleblower and other litigation and claims, as well as governmental and other regulatory investigations and proceedings. Litigation and governmental and regulatory investigations and proceedings are time-consuming, and may divert management’s attention and resources, cause us to incur significant expenses or liability or require us to change our business practices. Because of the potential risks, expenses and uncertainties of litigation, we may, from time to time, settle disputes, even where we believe that we have meritorious claims or defenses. Because litigation and governmental and regulatory investigations and proceedings are inherently unpredictable, we cannot assure you that the results of any of these actions will not have a material adverse effect on our business.
Natural disasters, geopolitical conflicts, or other natural or man-made catastrophic events could disrupt and impact our business.
Occurrence of any catastrophic event, including an earthquake, flood, wildfire, tsunami, or other weather event, power loss, internet failure, software or hardware malfunctions, cyber attack, war or foreign invasion (such as the Russian invasion of Ukraine and the Israel-Hamas war), terrorist attack, medical epidemic or pandemic (such as the COVID-19 pandemic), government shutdown orders, other man-made disasters, or other catastrophic events could disrupt our, our business partners’ and customers’ business operations or result in disruptions in the broader global economic environment. Any of these business disruptions may disrupt our business and materially and adversely affect our business and results of operations.
Adverse publicity stemming from any incident or perceived risk involving us, our customers, users of our products and services, other operators in the space sector or our competitors could have a material adverse effect on our business, financial condition and results of operations.
We are at risk of adverse publicity stemming from any public incident or perceived risk involving our Company, our customers, users of our core offerings, other operators in the space sector, our competitors, our people or our brand. If certain of our core offerings are sold to customers, and if such customers were to be involved in a public incident, accident or catastrophe, or if the market believed there to be substantial risks within our industry, this could create an adverse public perception of spaceflight and result in decreased customer demand for spaceflight experiences, which could cause a material adverse effect on our business, financial conditions and results of operations. The insurance we carry may be inapplicable or inadequate to cover any such incident, accident or catastrophe. In the event that our insurance is inapplicable or not adequate, we may be forced to bear substantial losses from any such incident, accident or catastrophe.
Our business involves significant risks and uncertainties that may not be covered by insurance or indemnity.
A significant portion of our business relates to designing, developing, engineering and manufacturing our space and defense technology offerings. New technologies may be untested or unproven. Failure of some of these offerings could result in extensive property damage. Accordingly, we may incur liabilities that are unique to our core offerings.
We endeavor to obtain insurance coverage from established insurance carriers to cover these risks and liabilities consistent with industry norms. However, the amount of insurance coverage that we maintain may not be adequate to cover all claims or liabilities. Existing coverage may be canceled while we remain exposed to the risk and it is not possible to obtain insurance to protect against all operational risks, natural hazards and liabilities.
We have historically insured certain of our core offerings to the extent that insurance was available on acceptable premiums and other terms. The insurance proceeds received in connection with a partial or total loss of the functional capacity of certain of our core
offerings would not be sufficient to cover the replacement cost, if we choose to do so, of such offerings. In addition, this insurance will not protect us against all losses to our core offerings due to specified exclusions, deductibles and material change limitations and it may be difficult to insure against certain risks, including on-orbit performance of an overall system or portion of such a system. In addition, problems and delays in development or delivery as a result of issues with respect to design, technology, licensing and patent rights, labor, learning curve assumptions or materials and components could prevent us from achieving contractual requirements. In many circumstances, we may receive indemnification from the U.S. government. We generally do not receive indemnification from foreign governments.
The price and availability of insurance fluctuate significantly. Although we have historically been able to obtain insurance coverage, we cannot guarantee that we will be able to do so in the future. Any determination we make as to whether to obtain insurance coverage will depend on a variety of factors, including the availability of insurance in the market, the cost of available insurance and other factors. Insurance market conditions or factors outside our control at the time we are in the market for the required insurance, such as unrelated launch failures and on-orbit failures, could cause premiums to be significantly higher than current estimates and could reduce amounts of available coverage. The cost of our insurance has been increasing and may continue to increase. Higher premiums on insurance policies will reduce our operating income by the amount of such increased premiums. If the terms become less favorable than those currently available, there may be limits on the amount of coverage that we can obtain or we may not be able to obtain insurance at all.
In addition, any accident or incident for which we are liable, even if fully insured, could negatively affect our standing with our customers and the public, thereby making it more difficult for us to compete effectively, and could significantly impact the cost and availability of adequate insurance in the future. Any disruption of our ability to operate our business could result in a material decrease in our revenues or significant additional costs to replace, repair or insure our assets, which could have a material adverse impact on our financial condition and results of operations.
If we fail to respond to commercial industry cycles in terms of our cost structure, manufacturing capacity, and/or personnel needs, our business could be seriously harmed.
The timing, length, and severity of the up-and-down cycles in the UAS, autonomous technology, commercial space, defense, space and space-related industries, as a result of macro-economic conditions, market-wide liquidity shortages or for other reasons, are difficult to predict. The cyclical nature of the industries in which we operate affects our ability to accurately predict future revenue, and in some cases, future expense levels. During down cycles in our industry, the financial results of our customers may be negatively impacted, which could result not only in a decrease in orders but also a weakening of their financial condition that could impair our ability to recognize revenue or to collect on outstanding receivables. When cyclical fluctuations result in lower than expected revenue levels, operating results may be adversely affected and cost reduction measures may be necessary in order for us to remain competitive and financially sound. We must be in a position to adjust our cost and expense structure to reflect prevailing market conditions and to continue to motivate and retain our key employees. If we fail to respond, then our business could be seriously harmed. In addition, during periods of rapid growth, we must be able to increase engineering and manufacturing capacity and personnel to meet customer demand. We can provide no assurance that these objectives can be met in a timely manner in response to industry cycles. Each of these factors could adversely impact our operating results and financial condition.
Our future growth depends on the demand for, and customers’ willingness to adopt, our core offerings, including UAS technology.
Evolving global security requirements and increasing demand for efficient supply chain and logistics solutions may present opportunities for growth in the markets for our core offerings, including for autonomous aerial systems and advanced UAS technology. However, potential failure to manage the risks described above may discourage current or potential customers from purchasing our core offerings, including our UAS products. If the market for our core offerings, including UAS products, does not develop as we expect or develops more slowly than we expect, our business, prospects, financial condition and operating results may be adversely affected.
Any delays in the development, design, engineering and manufacturing of our core offerings may adversely impact our business, financial condition and results of operations.
We have previously experienced, and may experience in the future, delays or other complications in the design, manufacture, production, delivery and servicing ramp of our space and defense technology offerings. If delays like this arise or recur, if our remediation measures and process changes do not continue to be successful or if we experience issues with planned manufacturing improvements or design and safety, we could experience issues or delays in increasing production further.
If we encounter difficulties in scaling our delivery or servicing capabilities, if we fail to develop and successfully commercialize our core offerings, if we fail to develop such technologies before our competitors, or if such technologies fail to perform as expected, are inferior to those of our competitors or are perceived to offer less mission assurance than those of our competitors, our business, financial condition and results of operations could be materially and adversely impacted.
We rely on a limited number of suppliers for certain raw materials and supplied components. We may not be able to obtain sufficient raw materials or supplied components to meet our manufacturing, design and operating needs, or obtain such materials on favorable terms or at all, which could impair our ability to fulfill our orders in a timely manner or increase our costs of design and production.
Our ability to produce our current and future space and defense technology offerings and other components of operation is dependent upon sufficient availability of raw materials and supplied components, which we secure from a limited number of suppliers. Our reliance on suppliers to secure raw materials and supplied components exposes us to volatility in the prices and availability of these materials. We may not be able to obtain sufficient supplies of raw materials or supplied components on favorable terms or at all, which could result in delays in the manufacture of our space and defense technology offerings or increased costs.
In addition, we may in the future experience delays in manufacturing or operation as we go through the requalification process with any replacement third-party supplier, as well as the limitations imposed by the ITAR, the EAR, or other restrictions on transfer of sensitive technologies. Moreover, the imposition of tariffs on such raw materials or supplied components could have a material adverse effect on our operations. Prolonged disruptions in the supply of any of our key raw materials or components, difficulty qualifying new sources of supply, implementing use of replacement materials or new sources of supply or any volatility in prices could have a material adverse effect on our ability to operate in a cost-efficient, timely manner and could cause us to experience cancellations or delays of scheduled missions, customer cancellations or reductions in our prices and margins, any of which could harm our business, financial condition and results of operations.
Unsatisfactory performance of our core offerings could have a material adverse effect on our business, financial condition and results of operation.
We manufacture, design and engineer highly sophisticated space and defense technology offerings that depend on complex technology. While we have built operational processes to ensure that the design, manufacture, performance and servicing meet rigorous performance goals, there can be no assurance that we will not experience operational or process failures and other problems, including through manufacturing or design defects, operator error, cyber-attacks or other intentional acts, that could result in potential safety risks. Any actual or perceived safety or mission assurance issue may result in significant reputational harm to our businesses, in addition to tort liability, maintenance, increased mission assurance infrastructure and other costs that may arise. While we are committed to producing safe products, there can be no assurance that our safety technology will be effective in preventing incidents related to product safety. Failure to ensure the safe operation of our products may affect our reputation and the sale of our products, which may ultimately have a materially adverse effect on our business operation and financial results. Further, the uncertainty of harsh space environmental risks, such as satellite ingestion, solar flares, coronal mass ejectors, meteor showers and other extreme space weather events also may cause the performance of certain of our core offerings to be unsatisfactory. Similarly, unsatisfactory performance of certain of our products resulting from the environments in which drones operate, including in combat or other areas where wars and hostilities may occur (for example, the war in Ukraine), or numerous other market and technological factors may cause the demand for our products and technologies to decline or be subject to variation and may cause variations in the market price of our common stock. Such issues with our core offerings could also result in our customers’ delaying or cancelling planned missions, increased regulation or other systemic consequences. Our inability to meet our mission assurance standards or adverse publicity affecting our reputation as a result of accidents, mechanical failures, or damages to customer property could have a material adverse effect on our business, financial condition and results of operation.
Our core offerings are extremely complex and must operate successfully with complex products of our customers and their other vendors. Our core offerings may contain undetected errors when first introduced or as we introduce product upgrades. The pressures we face to be the first to market new products or functionality and the elapsed time before our core offerings are integrated into our customers’ systems increases the possibility that we will offer products in which we or our customers later discover problems. We have experienced new product and product upgrade errors in the past and may experience similar problems in the future. These problems may cause us to incur significant warranty costs, costs to support our service contracts, expenses not covered by insurance or indemnification from the customer and divert the attention of personnel from our product development efforts. Also, hostile third parties or nation states may try to install malicious code or devices into our core offerings. Undetected errors may adversely affect our core offerings ease of use and may create customer satisfaction issues. If we are unable to repair these problems in a timely manner, we may experience a loss of or delay in revenue and significant damage to our reputation and business prospects. Many of our customers rely upon our core offerings for mission-critical applications. Because of this reliance, errors, defects, or other performance problems in our core offerings could result in significant financial and other damage to our customers. Our customers could attempt to recover those losses by pursuing products liability claims against us which, even if unsuccessful, would likely be time-consuming and costly to defend and could adversely affect our reputation.
As a result, either we or the customer may terminate a contract as a result of process failures, undetected errors or a material uncured breach by the other. If we breach a contract or fail to perform in accordance with contractual service levels, delivery schedules, performance specifications, or other contractual requirements set forth therein, the other party thereto may terminate such contract for
default, and we may be required to refund money previously paid to us by the customer or to pay penalties or other damages. Even if we have not breached, we may deal with various situations from time to time that may result in the amendment or termination of a contract. These steps can result in significant current period charges and/or reductions in current or future revenue, and/or delays in collection of outstanding receivables and costs incurred on the contract.
Our results of operations and cash flows are substantially affected by our mix of fixed-price, cost-plus and time-and-material type contracts. Our profits may decrease and/or we may incur significant unanticipated costs if we do not accurately estimate the costs of these engagements.
We generate revenue through various fixed-price, cost-plus and time-and-material (“T&M”) contracts. A significant number of our arrangements with our customers are on fixed-price contracts, rather than contracts in which payment to us is determined on a T&M or other basis. These fixed-price contracts allow us to benefit from any cost savings we achieve, but also subject us to the risk of potential cost overruns, particularly for firm fixed-price contracts because we assume all of the cost burden. We evaluate the contract value and cost estimates for performance obligations at least quarterly, and more frequently when circumstances change significantly. If our initial estimates are incorrect, we can lose money on these contracts. U.S. government contracts can expose us to potentially large losses because the U.S. government can hold us responsible for completing a project or, in certain circumstances, paying the entire cost of its replacement by another provider regardless of the size or foreseeability of any cost overruns that occur over the life of the contract. Because many of these contracts involve new technologies and applications and can last for years, unforeseen events, such as technological difficulties, fluctuations in the price of raw materials, a significant increase in inflation in the U.S. or other countries, problems with our suppliers and cost overruns, can result in the contractual price becoming less favorable or even unprofitable to us over time. Our failure to estimate accurately the resources and schedule required for a project, or our failure to complete our contractual obligations in a manner consistent with the project plan upon which our fixed-price contract was based, could adversely affect our overall profitability and could have a material adverse effect on our business, financial condition, and results of operations. We are consistently entering into contracts for large projects that magnify this risk. We have been required to commit unanticipated additional resources to complete projects in the past, which has occasionally resulted in losses on those contracts. We could experience similar situations in the future. In addition, we may fix the price for some projects at an early stage of the project engagement, which could result in a fixed price that is too low. Therefore, any changes from our original estimates could adversely affect our business, financial condition, and results of operations.
Our cash flow and profitability could be reduced if expenditures are incurred prior to the final receipt of a contract.
We provide various professional services, specialized products, and sometimes procure equipment and materials on behalf of our customers under various contractual arrangements. From time to time, in order to ensure that we satisfy our customers’ delivery requirements and schedules, we may elect to initiate procurement in advance of receiving final authorization from the government customer or a prime contractor. In addition, from time to time, we may build production units in advance of receiving an anticipated contract award. If our government or prime contractor customer’s requirements should change, if the government or the prime contractor should direct the anticipated procurement to another contractor, if the anticipated contract award does not materialize, or if the equipment or materials become obsolete or require modification before we are under contract for the procurement, our investment in the equipment or materials might be at risk if we cannot efficiently resell them. This could reduce anticipated earnings or result in a loss, negatively affecting our cash flow and profitability.
We may in the future invest significant resources in developing new offerings and exploring the application of our technologies for other uses and those opportunities may never materialize.
While our primary focus for the foreseeable future will be on our space and defense technology offerings, we may invest significant resources in developing new technologies, services, products and offerings. However, we may not realize the expected benefits of our recent investments in UAS and autonomous technology offerings or in any other future investments. In addition, we expect to explore the application of our proprietary technologies for other commercial and government uses, including those that are Earth-based. These anticipated technologies, however, are unproven and these products or technologies may never materialize or be commercialized in a way that would allow us to generate ancillary revenue streams. Relatedly, if such technologies become viable offerings in the future, we may be subject to competition from our competitors within the space-infrastructure and UAS industries, some of which may have substantially greater monetary and knowledge resources than we have and expect to have in the future to devote to the development of these technologies. Such competition or any limitations on our ability to take advantage of such technologies could impact our market share, which could have a material adverse effect on our business, financial condition and results of operations.
Such research and development initiatives may also have a high degree of risk and involve unproven business strategies and technologies with which we have limited operating or development experience. They may involve claims and liabilities (including, but not limited to, personal injury claims), expenses, regulatory challenges and other risks that we may not be able to anticipate. There can be no assurance that consumer demand for such initiatives will exist or be sustained at the levels that we anticipate, or that any of these initiatives will gain sufficient traction or market acceptance to generate sufficient revenue to offset any new expenses or liabilities associated with these new investments. Further, any such research and development efforts could distract management from current
operations, and would divert capital and other resources from our more established offerings and technologies. Even if we were to be successful in developing new products, services, offerings or technologies, regulatory authorities may subject us to new rules or restrictions in response to our innovations that may increase our expenses or prevent us from successfully commercializing new products, services, offerings or technologies.
We may not be able to convert our orders in backlog into revenue.
As of December 31, 2025, our contracted backlog consisted of $411.2 million in customer contracts. However, many of these contracts are cancellable by customers for convenience. In the event of a cancellation for convenience, we are generally entitled to be compensated for the work performed up to the date of cancellation. The remaining amounts may not be collected in this situation.
In addition, backlog is typically subject to large variations from quarter to quarter and comparisons of backlog from period to period are not necessarily indicative of future revenues. Furthermore, some contracts comprising the backlog are for services scheduled many years in the future, and the economic viability of customers with whom we have contracted is not guaranteed over time. As a result, the contracts comprising our backlog may not result in actual revenue in any particular period or at all, and the actual revenue from such contracts may differ from our backlog estimates. The timing of receipt of revenues, if any, on projects included in backlog could change because many factors affect the scheduling of missions and adjustments to contracts may also occur. The failure to realize some portion of our backlog could adversely affect our revenues and gross margins. Furthermore, the presentation of our financial results requires us to make estimates and assumptions that may affect revenue recognition and changes in estimates are likely to occur from period to period. Accordingly, actual results could differ significantly from our estimates.
We have and in the future may continue to use artificial intelligence in our business, and challenges with properly managing its use could result in reputational harm, competitive harm, and legal liability, and adversely affect our business, financial condition and results of operations.
We have and in the future may continue to incorporate AI solutions into our core offerings, and these applications may become important in our operations over time. Our competitors or other third parties may incorporate AI into their products or services more quickly or more successfully than we may, which could impair our ability to compete effectively and adversely affect our results of operations. Additionally, if the content, analyses, or recommendations that AI applications assist in producing are or are alleged to be deficient, inaccurate, or biased, our business, financial condition, and results of operations may be adversely affected. The use of AI applications has resulted in, and may in the future result in, cybersecurity incidents. Any such cybersecurity incidents related to our use of AI applications could adversely affect our reputation and results of operations. AI also presents emerging ethical issues and if our use of AI becomes controversial, we may experience brand or reputational harm, competitive harm, or legal liability. The rapid evolution of AI, including potential government regulation of AI, will require significant resources to develop, test and maintain our platform, offerings, services, and features to help us implement AI ethically in order to minimize unintended, harmful impact, which may be costly and may not produce the benefits and results that we expect.
AI is enabled by or integrated into some of our software and is a significant and potentially growing element of our business. As with many developing technologies, AI presents risks and challenges that could affect its further development, adoption, and use, and therefore our business. AI algorithms may be flawed. Datasets may be insufficient, of poor quality, or contain biased information. Inappropriate or controversial data practices by data scientists, engineers, and end-users of our systems could impair the acceptance of AI solutions. If the recommendations, forecasts, or analyses that AI applications assist in producing are deficient or inaccurate, we could be subjected to competitive harm, potential legal liability, and brand or reputational harm. Though our technologies and business practices are designed to mitigate many of these risks, if we enable or offer AI solutions that are controversial because of their purported or real impact on human rights, privacy, employment, or other social issues, we may experience brand or reputational harm.
We are dependent on third-party launch vehicles to launch our spacecraft and customer payloads into space.
Currently there are only a handful of companies who offer launch services, and if this sector of the space industry does not grow or there is consolidation among these companies, this could result in a shortage of space on these launch vehicles and we may not be able to secure space on a launch vehicle, which may cause delays in our ability to meet our customers’ needs. Additionally, a shortage of space available on launch vehicles may cause prices to increase or cause delays in our ability to meet our customers’ needs. Either of these situations could have a material adverse effect on our results of operations and financial condition.
We may experience a total loss of our technology and products and our customers’ payloads if there is an accident on launch or during the journey into space.
Although there have been and will continue to be technological advances in spaceflight, it is still an inherently dangerous activity. Explosions and other accidents on launch or during the flight have occurred and will likely occur in the future. If such incidents should occur, we will likely experience a total loss of our systems, products, technologies and services and our customers’ payloads. The total or partial loss of one or more of our products or customer payloads could have a material adverse effect on our results of operations and financial condition. For some missions, we can elect to buy launch insurance, which can reduce our monetary losses from the
launch failure, but even in this case we will have losses associated with our inability to test our technology in space and delays with further technology development.
Our operating results may fluctuate significantly, which makes our future operating results difficult to predict and could cause our operating results to fall below expectations or any guidance we may provide.
Our quarterly and annual revenue and operating results have fluctuated and may fluctuate significantly, which makes it difficult for us to predict our future operating results. Reductions in revenue in a particular quarter could lead to lower profitability in that quarter because a relatively large amount of our expenses are fixed in the short-term. We may incur significant operating expenses during the start-up and early stages of large contracts and may not be able to recognize corresponding revenue in that same quarter. We may also incur additional expenses when contracts are terminated or expire and are not renewed as a result of the customer experiencing a change in control or otherwise.
In addition, payments due to us from our customers may be delayed due to billing cycles or as a result of failures of government budgets to gain congressional and administration approval in a timely manner. The U.S. government’s fiscal year ends September 30. If a federal budget for the next federal fiscal year has not been approved by that date in each year, our customers may have to suspend engagements that we are working on until a budget has been approved. Any such suspensions may reduce our revenue in the fourth quarter of the federal fiscal year or the first quarter of the subsequent federal fiscal year. The U.S. government’s fiscal year end can also trigger increased purchase requests from customers for equipment and materials. Any increased purchase requests we receive as a result of the U.S. government’s fiscal year end would serve to increase our third or fourth quarter revenue, but will generally decrease profit margins for that quarter, as these activities generally are not as profitable as our typical offerings.
Additional factors that may cause our financial results to fluctuate from quarter to quarter include those addressed elsewhere in this “Risk Factors” section and the following factors, among others:
•the terms of customer contracts that affect the timing of revenue recognition;
•variability in demand for our services and solutions;
•commencement, completion or termination of contracts during any particular quarter;
•timing of shipments and product deliveries;
•timing of award or performance incentive fee notices;
•timing of significant bid and proposal costs;
•the costs of remediating unknown defects, errors or performance problems of our product offerings;
•unexpected weather patterns, natural disasters or other events that force a cancellation or rescheduling of launches;
•the cost of raw materials or supplied components critical for the manufacture and operation of our space and defense technology offerings;
•variable purchasing patterns under blanket purchase agreements and other indefinite delivery/indefinite quantity (“IDIQ”) contracts;
•restrictions on and delays related to the export of defense articles and services;
•costs related to government inquiries, changes in governmental regulations or in the status of our regulatory approvals or applications;
•strategic decisions by us or our competitors, such as acquisitions, divestitures, spin-offs and joint ventures;
•strategic investments or changes in business strategy;
•the timing and cost of, and level of investment in, research and development relating to our core offerings and our current or future facilities
•changes in the extent to which we use subcontractors;
•seasonal fluctuations in our staff utilization rates;
•changes in our effective tax rate, including changes in our judgment as to the necessity of the valuation allowance recorded against our deferred tax assets;
•the length of sales cycles;
•future accounting pronouncements or changes in our accounting policies;
•the impact of epidemics or pandemics; and
•general market conditions and other factors, including factors unrelated to our operating performance or the operating performance of our competitors.
The individual or cumulative effects of factors discussed above could result in large fluctuations and unpredictability in our quarterly and annual operating results. As a result, comparing our operating results on a period-to-period basis may not be meaningful.
This variability and unpredictability could also result in our failing to meet the expectations of industry or financial analysts or investors for any period. If our revenue or operating results fall below the expectations of analysts or investors or below any guidance we may provide, or if any guidance we provide is below the expectations of analysts or investors, the price of our common stock could decline substantially. Such a stock price decline could occur even when we have met any previously publicly stated guidance we may provide.
Additionally, significant fluctuations in our operating results for a particular quarter could cause us to fall out of compliance with the financial covenants related to our debt, which if not waived, could restrict our access to capital and cause us to take extreme measures to pay down the debt, if any, under the Adams Street or JPMorgan credit agreements.
Our margins and operating results may suffer if we experience unfavorable changes in the proportion of cost-plus-fee or fixed-price contracts in our total contract mix.
Although fixed-price contracts entail a greater risk of a reduced profit or financial loss on a contract compared to other types of contracts we enter into, fixed-price contracts typically provide higher profit opportunities because we may be able to benefit from cost savings and operating efficiencies. In contrast, cost-plus-fee contracts are subject to statutory limits on profit margins and generally are the least profitable of our contract types. Our customers could influence or determine what type of contract we enter into and to the extent that we enter into more cost-plus-fee or less fixed-price contracts in proportion to our total contract mix in the future, our margins and operating results may suffer. Our operating results may also suffer to the extent we have a contract mix that is focused on developmental projects, which are typically at lower profit margins as compared to margins on production projects.
Our systems, products, technologies and services and related equipment may have shorter useful lives than we anticipate.
Our growth strategy depends in part on developing reusable space and defense technology offerings. These reusable offerings and other space-related and UAS technology and systems will have a limited useful life. While we intend to design our core offerings for a certain lifespan, which corresponds to a number of cycles, there can be no assurance as to the actual operational life of a product or that the operational life of individual components will be consistent with its design life. A number of factors will impact the useful lives of our core offerings, including, among other things, the quality of their design and construction, the durability of their component parts and availability of any replacement components, and the occurrence of any anomaly or series of anomalies or other risks affecting the technology during launch, flight or in orbit. In addition, any improvements in technology may make our existing products, designs or any component of our core offerings prior to the end of its life obsolete. If our space and defense technology offerings and related equipment have shorter useful lives than we currently anticipate, this may lead to delays in increasing the rate of our follow-on work and new business, which would have a material adverse effect on our business, financial condition and results of operations. In addition, we are continually learning, and as our engineering and manufacturing expertise and efficiency increases, we aim to leverage this learning to be able to manufacture our core offerings and equipment using less of our currently installed equipment, which could render our existing inventory obsolete. Any continued improvements in spaceflight technology and space-related technology may make our existing products or any component of our products obsolete prior to the end of its life. If our equipment and materials have shorter useful lives than we currently anticipate, this may lead to delays in the manufacturing and design of UAS, space and spaceflight components and may also lead to a delay in commencing additional operations or increasing the rate of our operations, or greater maintenance costs than previously anticipated such that the cost to maintain the products and related equipment may exceed their value, which would have a material adverse effect on our business, financial condition and results of operations.
Cyber-attacks and other security threats and disruptions could have a material adverse effect on our business, financial condition and operating results.
As an aerospace and defense company, we face a multitude of security threats, including cybersecurity threats ranging from attacks common to most industries, such as ransomware and denial-of-service, to attacks from more advanced and persistent, highly organized adversaries, including nation state actors, that target the defense industrial base and other critical infrastructure sectors. The sophistication of the threats continue to evolve and grow, including risks associated with the use of emerging technologies, such as AI and quantum computing, for nefarious purposes. In addition to cybersecurity threats, we face threats to the security of our facilities and employees from terrorist acts, sabotage or other disruptions, any of which could adversely affect our business. The improper conduct of our employees or others working on behalf of us who have access to export controlled, classified or other sensitive information could also adversely affect our business and reputation.
If we are unable to protect sensitive information, including complying with evolving information security, data protection and privacy regulations, our customers or governmental authorities could investigate the adequacy of our threat mitigation and detection processes and procedures, and could bring actions against us for noncompliance with applicable laws and regulations. Moreover, depending on the severity of an incident, our customers’ data, our employees’ data, our intellectual property (including trade secrets and research, development and engineering know-how), and other third-party data (such as subcontractors, suppliers and vendors) could be compromised, which could adversely affect our business. Products and services provided to customers also carry cybersecurity risks, including risks that our products and services could be breached or fail to detect, prevent or combat attacks, the realization of which could result in losses to our customers and claims against us, and could harm our customer relationships and financial results.
Similar to many other companies, we experience attempts to gain unauthorized access to our systems and information on a regular basis, and a number of our employees work remotely, which may create additional opportunities for cybercriminals to exploit vulnerabilities. Despite our security measures, including employee training, our information technology and infrastructure are vulnerable to cyber-attacks, malicious intrusions, breakdowns, destruction, loss of data privacy, breaches due to employee error, malfeasance or other disruptions. Given the persistence, sophistication, volume and novelty of threats we face, we may not be successful in preventing or mitigating an attack that could have a material adverse effect on us and the costs related to cyber or other security threats or disruptions may not be fully insured or indemnified by other means. The nature of the national security aspects of our business and much of the data we protect increases and creates different risks relative to other industries. National security considerations may also limit the extent to which we may be able to publicly disclose a cybersecurity incident.
Our customers, suppliers, subcontractors and joint venture partners face similar security threats and an incident at one of these entities could adversely impact our business. These entities are typically outside our control and may have access to our information with varying levels of security and cybersecurity resources, expertise, safeguards and capabilities. Their relationships with government contractors, including us, may increase the risk that they are targeted by the same threats we face, and such entities may not be adequately prepared to detect, mitigate and respond to such threats. Adversaries actively seek to exploit security and cybersecurity weaknesses in our supply chain. Breaches in our multi-tiered supply chain, which is comprised of thousands of direct and indirect suppliers, has and could in the future compromise our data and adversely affect customer deliverables. We also must rely on our supply chain for adequately detecting and reporting cyber incidents, which could affect our ability to report or respond to cybersecurity incidents effectively or in a timely manner.
We use proprietary software which we have developed in our space and defense technology offerings, which we seek to continually update and improve. This software supports UAS, autonomous technology, spacecraft and constellation developers in the design, development, deployment, management, maintenance and cyber protection of their assets. Replacing such systems is often time-consuming and expensive and can also be intrusive to daily business operations. Further, we may not always be successful in executing these upgrades and improvements, which may occasionally result in a failure of our systems. We may experience periodic system interruptions from time to time. Any slowdown or failure of our underlying technology infrastructure could harm our business, reputation and ability to execute on our business plan, which could materially and adversely affect our results of operations. Our disaster recovery plan or those of our third-party providers may be inadequate, and our business interruption insurance may not be sufficient to compensate us for the losses that could occur.
Our business, financial condition and results of operations are subject to risks resulting from broader geographic operations.
Our operations outside of the U.S. may lead to more volatile financial results and make it more difficult for us to manage our business. Reasons for this include, but are not limited to, the following:
•political and economic instability;
•governments’ restrictive trade policies;
•the imposition or rescission of duties, taxes or government royalties;
•exchange rate risks;
•exposure to varying legal standards, including data privacy, security and intellectual property protection in other jurisdictions;
•difficulties in obtaining required regulatory authorizations;
•local domestic ownership requirements;
•requirements that certain operational activities be performed in-country;
•changing and conflicting national and local regulatory requirements; and
•the geographic, language and cultural differences between personnel in different areas of the world.
Our international business is subject to both U.S. and foreign laws and regulations, including, without limitation, laws and regulations relating to export/import controls, economic sanctions, technology transfer restrictions, government contracts and procurement, data
privacy and protection, anti-corruption (including the anti-bribery, books and records, and internal controls provisions of the U.S. Foreign Corrupt Practices Act (“FCPA”) governing interactions with foreign government officials), the anti-boycott provisions of the U.S. Export Administration Act, security restrictions and intellectual property. Failure by us, our employees, subsidiaries, affiliates, partners or others with whom we work to comply with any of these applicable laws and regulations could result in administrative, civil, commercial or criminal liabilities, including suspension or debarment from government contracts or suspension of our export/import privileges. New regulations and requirements, or changes to existing ones in the various countries in which we operate can significantly increase our costs and risks of doing business internationally.
Changes in laws, regulations, political leadership and environment, and/or security risks may dramatically affect our ability to conduct or continue to conduct business in international markets, including sales to customers and purchases from suppliers outside the United States. We may also be impacted by shifts in U.S. and foreign national policies and priorities, political decisions and geopolitical relationships. Any changes to these policies could impact our operations and/or export authorizations, or delay purchasing decisions or payments and the provision of supplies, goods and services including, without limitation, in connection with any government programs.
Net earnings and net assets could be materially affected by an impairment of goodwill.
We have a significant amount of goodwill recorded on our consolidated balance sheet as of December 31, 2025, much of which is goodwill arising from the Edge Acquisition. We are required at least annually to test the recoverability of goodwill or more frequently when events and circumstances indicate that it is more likely than not that the fair value of a reporting unit is less than its carrying value. The recoverability test of goodwill is based on the current fair value of our identified reporting units. Fair value measurement requires assumptions and estimates of many critical factors, including revenue and market growth, operating cash flows and discount rates. In previous years, we have recorded impairment charges and during the fourth quarter of 2025, the Company performed its annual quantitative goodwill impairment test and determined that the estimated fair value of the Space Europe reporting unit was lower than its carrying value and as a result reduced the balance of goodwill to zero and recognized a full impairment on certain tangible and intangible assets within the reporting unit. Please refer to Note F, Note G and Note H of the accompanying notes to the consolidated financial statements for additional information. If general market conditions deteriorate in portions of our business, we could experience a significant decline in the fair value of our reporting units. This decline could lead to an impairment of all or a significant portion of the goodwill balance, which could materially affect our net earnings and net assets.
The Company’s ability to use its net operating loss carryforwards and certain other tax attributes may be limited.
As of December 31, 2025, the Company had $80.4 million of net operating losses (“NOLs”) available to reduce future taxable income resulting in U.S. federal, state (net), and foreign deferred tax assets of $54.1 million, $16.1 million, and $10.2 million, respectively. The $54.1 million in U.S. federal net operating loss carryforwards may be carried forward indefinitely for U.S. federal tax purposes. Certain state and foreign net operating loss carryforwards will begin to expire in 2039. It is possible that the Company will not generate sufficient taxable income to use these NOLs before their expiration or at all.
Any limitation on using NOLs could, depending on the extent of such limitation and the NOLs previously used, result in the Company retaining less cash after payment of U.S. federal and state income taxes during any year in which we have taxable income, rather than losses, than the Company would be entitled to retain if such NOLs were available as an offset against such income for U.S. federal and state income tax reporting purposes, which could adversely impact the Company’s operating results.
Risks Related to Government Contracts
We are subject to the requirements of the National Industrial Security Program Operating Manual (“NISPOM”) for our facility security clearance, which is a prerequisite to our ability to perform on classified contracts for the U.S. government.
A facility security clearance is required in order to be awarded and perform on classified contracts for the U.S. DoW and certain other agencies of the U.S. government. As a cleared entity, we must comply with the requirements of NISPOM, and any other applicable U.S. government industrial security regulations.
Certain of our facilities maintain a facility security clearance and many of our employees maintain a personal security clearance in order to access sensitive information necessary to the performance of our work on certain U.S. government contracts and subcontracts. Failure to comply with the NISPOM or other security requirements may subject us to civil or criminal penalties, loss of access to sensitive information, loss of a U.S. government contract or subcontract, or potentially debarment as a government contractor. Therefore, any failure to comply with U.S. government security protocols could adversely affect our ability to operate.
If we were to violate the terms and requirements of the NISPOM, or any other applicable U.S. government industrial security regulations (which may apply to us under the terms of classified contracts), we could lose our security clearance. Even if we implement centralized compliance policies, we cannot be certain that we will be able to maintain our security clearance if a breach or violation occurs. If for some reason our security clearance is invalidated or terminated, we may not be able to continue to perform on
classified contracts and would not be able to enter into new classified contracts, which could materially adversely affect our business, financial condition, and results of operations.
We depend heavily on contracts with the U.S. government for a substantial portion of our business. Changes in the U.S. government’s priorities, or delays or reductions in spending, could have a material adverse effect on our business.
A reduction in overall U.S. government spending, on an absolute or inflation-adjusted basis, because of shifting priorities, budget compromises or otherwise could adversely affect our business. Budget uncertainty, the potential for U.S. government shutdowns, the use of continuing resolutions, and the federal debt ceiling can adversely affect our industry and the funding for our programs. While the recent government shutdown has ended, there is no assurance that future government shutdowns will be avoided that affect government contractors or government-funded programs. If appropriations are delayed or a government shutdown were to occur and continue for an extended period of time, we could be at risk of reduced orders, program cancellations and other disruptions and nonpayment. When the U.S. government operates under a continuing resolution, new contract and program starts are restricted and funding for our programs may be unavailable, reduced or delayed.
Our contracts with the U.S. government are conditioned upon the continuing availability of Congressional appropriations. Congress usually appropriates funds on a fiscal year (“FY”) basis even though contract performance may extend over many years. Consequently, contracts are often partially funded initially, and additional funds are committed only as Congress makes further appropriations over time. To the extent we incur costs in excess of funds obligated on a contract or in advance of a contract award or contract definitization, we are at risk of not being reimbursed for those costs unless and until additional funds are obligated under the contract or the contract is successfully awarded, definitized and funded, which could adversely affect our results of operations, financial condition and cash flows.
Failure to fund or the termination of significant programs or contracts by the U.S. government could adversely affect our business and financial performance. Changes in U.S. government funding priorities also could reduce opportunities in existing programs and in future programs or initiatives where we intend to compete and where we have made investments. While we would expect to compete and be well positioned as the incumbent on existing programs, we may not be successful and, even if we are successful, the replacement programs may be funded at lower levels or result in lower margins.
We depend significantly on U.S. government contracts, which often are only partially funded, subject to immediate termination, and heavily regulated and audited. The termination or failure to fund, or negative audit findings for, one or more of these contracts could have an adverse impact on our business, financial condition, results of operations and cash flows.
Generally, U.S. government contracts are subject to oversight audits by U.S. government representatives. Such audits could result in adjustments to our contract costs. Any costs found to be improperly allocated to a specific contract will not be reimbursed, and such costs already reimbursed must be refunded. We have recorded contract revenue based on costs we expect to realize upon final audit. However, we do not know the outcome of any future audits and adjustments, and we may be required to materially reduce our revenue or profits upon completion and final negotiation of audits. Negative audit findings could also result in termination of a contract, forfeiture of profits, suspension of payments, fines or suspension or debarment from U.S. government contracting or subcontracting for a period of time.
In addition, U.S. government contracts generally contain provisions permitting termination, in whole or in part, without prior notice at the U.S. government’s convenience upon payment only for work done and commitments made at the time of termination. For some contracts, we are a subcontractor and not the prime contractor, and in those arrangements, the U.S. government could terminate the prime contractor for convenience without regard for our performance as a subcontractor. We can give no assurance that one or more of our U.S. government contracts will not be terminated under those circumstances. Also, we can give no assurance that we would be able to procure new contracts to offset the revenue or backlog lost as a result of any termination of our U.S. government contracts. Because a significant portion of our revenue is dependent on our performance and payment under our U.S. government contracts, the loss of one or more large contracts could have a material adverse impact on our business, financial condition, results of operations and cash flows.
Our U.S. government business also is subject to specific procurement regulations and a variety of socioeconomic and other requirements. These requirements, although customary in U.S. government contracts, increase our performance and compliance costs. These costs might increase in the future, thereby reducing our margins, which could have an adverse effect on our business, financial condition, results of operations and cash flows. In addition, the U.S. government has and may continue to implement initiatives focused on efficiencies, affordability and cost growth and other changes to its procurement practices. These initiatives and changes to procurement practices may change the way U.S. government contracts are solicited, negotiated and managed, which may affect whether and how we pursue opportunities to provide our products and services to the U.S. government, including the terms and conditions under which we do so, which may have an adverse impact on our business, financial condition, results of operations and cash flows. For example, contracts awarded under the DoW’s Other Transaction Authority for research and prototypes generally
require cost-sharing and may not follow, or may follow only in part, standard U.S. government contracting practices and terms, such as the Federal Acquisition Regulation (“FAR”) and Cost Accounting Standards.
Failure to comply with applicable regulations and requirements could lead to fines, penalties, repayments, or compensatory or treble damages, or suspension or debarment from U.S. government contracting or subcontracting for a period of time. Among the causes for debarment are violations of various laws and regulations, including those related to procurement integrity, export control (including ITAR), U.S. government security, employment practices, protection of the environment, accuracy of records, proper recording of costs and foreign corruption. The termination of a U.S. government contract or relationship as a result of any of these acts would have an adverse impact on our operations and could have an adverse effect on our standing and eligibility for future U.S. government contracts.
Our work for the U.S. government and international governments may expose us to increased security risks.
As a government contractor, given the enhanced sensitivity of the information we have access to and the nature of our products and services, we are at an increased risk of being targeted for cyber and other security attacks, including threats to the physical security of our facilities and employees. In addition, we work in international locations where there are high security risks, which could result in harm to our employees, contractors, and remote assets, and substantial protection or recovery costs. Some of our services are performed in or adjacent to high-risk locations where the country or location is experiencing political, social or economic issues, or war or civil unrest. In those locations where we have employees or operations, we may incur substantial costs to maintain the safety of our personnel, our remote assets and our information. As such international locations and the risks associated with them change rapidly, such precautions may be insufficient to avoid such risks including possible possession of our remote assets and related access to our intellectual property by unintended third parties and the possible loss of our personnel in these locations, which could harm our business and operating results.
Disputes with our subcontractors or the inability of our subcontractors to perform, or our key suppliers to timely deliver our components, parts or services, could cause our core offerings to be produced or delivered in an untimely or unsatisfactory manner.
We engage subcontractors on many of our contracts. We may have disputes with our subcontractors, including regarding the quality and timeliness of work performed by the subcontractor, customer concerns about the subcontract or subcontractor, our failure to extend existing task orders or issue new task orders under a subcontract, our hiring of the personnel of a subcontractor or vice versa or the subcontractor’s failure to comply with applicable law. In addition, there are certain parts, components and services for many of our space and defense technology offerings that we source from other manufacturers or vendors. Some of our suppliers, from time to time, experience financial and operational difficulties, which may impact their ability to supply the materials, components, subsystems and services that we require. Tariffs recently imposed or applied in the future on certain materials and other trade issues may create or exacerbate existing materials shortages and may result in further supplier business closures. Our supply chain could also be disrupted by external events, such as natural disasters or other significant disruptions (including extreme weather conditions, medical epidemics, acts of terrorism, cyber-attacks and labor disputes), governmental actions and legislative or regulatory changes, including product certification or stewardship requirements, sourcing restrictions, product authenticity and climate change or greenhouse gas emission standards, or availability constraints from increased demand from customers. These or any further political or governmental developments or health concerns could result in social, economic and labor instability. Any inability to develop alternative sources of supply on a cost-effective and timely basis could materially impair our ability to manufacture and deliver our space and defense technology offerings to our customers. We can give no assurances that we will be free from disputes with our subcontractors; material supply constraints or problems; or component, subsystems or services problems in the future. Also, our subcontractors and other suppliers may not be able to acquire or maintain the quality of the materials, components, subsystems and services they supply, which may result in greater product returns, service problems and warranty claims and could harm our business, financial condition, results of operations and cash flows. In addition, in connection with our government contracts, we are required to procure certain materials, components and parts from supply sources approved by the U.S. government and we rely on our subcontractors and suppliers to comply with applicable laws, regulations and other requirements regarding procurement of counterfeit, unauthorized or otherwise non-compliant parts or materials, including parts or materials they supply to us, and in some circumstances, we rely on their certifications as to their compliance. From time to time, there are components for which there may be only one supplier, which may be unable to meet our needs. Each of these subcontractor and supplier risks could have a material adverse effect on our business, financial condition, results of operations and cash flows.
Regulatory Risk Factors
Investments in us may be subject to U.S. foreign investment regulations which may impose conditions on or limit certain investors’ ability to purchase our common stock, potentially making our common stock less attractive to investors. Our investments in U.S. companies may also be subject to U.S. foreign investment regulations.
Under the “Exon-Florio Amendment” to the U.S. Defense Production Act of 1950, as amended (the “DPA”), the U.S. President has the power to disrupt or block certain foreign investments in U.S. businesses if he determines that such a transaction threatens U.S. national security. The Committee on Foreign Investment in the United States (“CFIUS”) has the authority to conduct national security
reviews of certain foreign investments. CFIUS may impose mitigation conditions to grant clearance of a transaction. The Foreign Investment Risk Review Modernization Act, enacted in 2018, amended the DPA to, among other things, expand CFIUS’s jurisdiction beyond acquisitions of control of U.S. businesses. Now, CFIUS also has jurisdiction over certain foreign non-controlling investments in U.S. businesses that involve critical technology or critical infrastructure, or that collect and maintain sensitive personal data of U.S. citizens (“TID U.S. Businesses”), if the foreign investor receives specified triggering rights or access in connection with its investment. We are a TID U.S. Business because we develop and design technologies that would be considered critical technologies. Certain foreign investments in TID U.S. Businesses are subject to mandatory filing with CFIUS. The enhanced scrutiny and potential restrictions on the ability of foreign persons to invest in us could limit our ability to engage in strategic transactions that could benefit our shareholders, including a change of control, and could also affect the price that an investor may be willing to pay for our common stock.
We are subject to trade control laws and regulations; including export controls and stringent U.S. economic sanctions, which could affect our ability to do business with certain customers. Unfavorable changes in these laws and regulations or U.S. government licensing policies, our failure to secure timely U.S. government authorizations under these laws and regulations, or our failure to comply with these laws and regulations could have a material adverse effect on our business, financial condition and results of operation.
Our business is subject to stringent U.S. trade control laws and regulations as well as economic sanctions laws and regulations. We are required to comply with U.S. export control laws and regulations, including ITAR administered by the U.S. Department of State, the EAR administered by the U.S. Department of Commerce’s Bureau of Industry and Security, and economic sanctions administered by the Treasury Department’s Office of Foreign Assets Control. Similar laws that impact our business exist in other jurisdictions. These foreign trade controls prohibit, restrict, or regulate our ability to, directly or indirectly, export, deemed export, re-export, deemed re-export or transfer certain hardware, technical data, technology, software, or services to certain countries and territories, entities, and individuals, and for end uses. Violations of applicable export control laws, sanctions, and related regulations could result in criminal and administrative penalties, including fines, possible denial of export privileges, and debarment, which could have a material adverse impact on our business, including our ability to enter into contracts or subcontracts for U.S. government customers.
Pursuant to these foreign trade control laws and regulations, we are required, among other things, to (i) maintain a registration under ITAR, (ii) determine the proper licensing jurisdiction and export classification of products, software, and technology, and (iii) obtain licenses or other forms of U.S. government authorization to engage in the conduct of our space-focused business. The authorization requirement includes the need to get permission to release controlled technology to foreign person employees and other foreign persons. In order to comply with these requirements, we must develop and implement centralized sanctions and export control policies that can be quickly adopted by all the Company’s subsidiaries.
The inability to secure and maintain necessary licenses and other authorizations could negatively impact our ability to compete successfully or to operate our spaceflight business as planned. Any changes in sanctions and export control regulations or U.S. government licensing policy, such as those necessary to implement U.S. government commitments to multilateral control regimes, may restrict our operations. Given the significant discretion the government has in issuing, denying or conditioning such authorizations to advance U.S. national security and foreign policy interests, there can be no assurance we will be successful in our current and future efforts to secure and maintain necessary licenses, registrations, or other U.S. government regulatory approvals. In addition, changes in U.S. foreign trade control laws and regulations, U.S. foreign policy, or reclassifications of our products or technologies, may restrict our future operations.
Our business is subject to a wide variety of additional extensive and evolving government laws and regulations. Failure to comply with such laws and regulations could have a material adverse effect on our business.
We are subject to a wide variety of laws and regulations relating to various aspects of our business, including with respect to our manufacturing in-space operations, UAS products, employment and labor, health care, tax, privacy and data security, health and safety, and environmental issues. Laws and regulations at the foreign, federal, state and local levels frequently change, especially in relation to new and emerging industries, and we cannot always reasonably predict the impact from, or the ultimate cost of compliance with, current or future regulatory or administrative changes. We monitor these developments and devote a significant amount of management’s time and external resources towards compliance with these laws, regulations and guidelines, and such compliance places a significant burden on management’s time and other resources, and it may limit our ability to expand into certain jurisdictions. Moreover, changes in law, the imposition of new or additional regulations or the enactment of any new or more stringent legislation that impacts our business could require us to change the way we operate and could have a material adverse effect on our sales, profitability, cash flows and financial condition.
Failure to comply with these laws, such as with respect to obtaining and maintaining licenses, certificates, authorizations and permits critical for the operation of our business, may result in civil penalties or private lawsuits, or the suspension or revocation of licenses, certificates, authorizations or permits, which would prevent us from operating our business. For example, commercial space launches and the operation of any space transport system in the U.S. require licenses and permits from the FCC and review by other agencies of
the U.S. government, including the DoW and NASA. License approval can include an interagency review of safety, operational, national security, and foreign policy and international obligations implications, as well as a review of foreign ownership. Similarly, the UAS industry is subject to several complex regulatory frameworks including National Defense Authorization Act compliance requirements, Federal Aviation Regulations, Defense Federal Acquisition Regulations, International Traffic in Arms Regulations and Export Administration Regulations.
In the U.S., the Federal Aviation Administration oversees the safety of aircraft operations in the national airspace system and has the authority to grant airworthiness certificates and related exemptions to UAS. Additionally, regulation of our industry is still evolving, and new or different laws or regulations could affect our operations, increase direct compliance costs for us or cause any third-party suppliers or contractors to raise the prices they charge us because of increased compliance costs. For example, the FCC has an open notice of proposed rulemaking relating to mitigation of orbital debris, which could affect us and our operations. Application of these laws to our business may negatively impact our performance in various ways, limiting the collaborations we may pursue, further regulating the export and re-export of our products, services, and technology from the U.S. and abroad, and increasing our costs and the time necessary to obtain required authorization. The adoption of a multi-layered regulatory approach to any one of the laws or regulations to which we are or may become subject, particularly where the layers are in conflict, could require alteration of our manufacturing processes or operational parameters which may adversely impact our business. We may not be in complete compliance with all such requirements at all times and, even when we believe we are in complete compliance, a regulatory agency may determine that we are not.
Our reputation and ability to do business may be impacted by the improper conduct of our employees, agents or business partners.
We have implemented compliance controls, training, policies and procedures designed to prevent and detect reckless or criminal acts from being committed by our employees, agents or business partners that would violate the laws of the jurisdictions in which we operate, including laws governing payments to government officials, such as the FCPA, the protection of export controlled or classified information, such as ITAR, false claims, procurement integrity, cost accounting and billing, competition, information security and data privacy and the terms of our contracts. This risk of improper conduct may increase as we continue to grow and expand our operations. We cannot ensure, however, that our controls, training, policies and procedures will prevent or detect all such reckless or criminal acts, and we have been adversely impacted by such acts in the past, which have been immaterial in nature. If not prevented, such reckless or criminal acts could subject us to civil or criminal investigations, monetary and non-monetary penalties and suspension and debarment by the U.S. government and could have a material adverse effect on our ability to conduct business, our results of operations and our reputation. In addition, misconduct involving data security lapses resulting in the compromise of personal information or the improper use of our customer’s sensitive or classified information could result in remediation costs, regulatory sanctions against us and serious harm to our reputation and could adversely impact our ability to continue to contract with the U.S. government.
Failure to comply with federal, state and foreign laws and regulations relating to privacy, data protection and consumer protection, or the expansion of current or the enactment of new laws or regulations relating to privacy, data protection and consumer protection, could adversely affect our business and our financial condition.
We collect, store, process, and use personal information and other customer data, and we rely in part on third parties that are not directly under our control to manage certain of these operations and to collect, store, process and use payment information. Due to the sensitivity of the personal information and data we and these third parties manage and expect to manage in the future, as well as the nature of our customer base, the security features of our information systems are critical. A variety of federal, state and foreign laws and regulations govern the collection, use, retention, storage, destruction, sharing and security of this information. Laws and regulations relating to privacy, data protection and consumer protection are evolving and subject to potentially differing interpretations. These requirements may not be harmonized, may be interpreted and applied in a manner that is inconsistent from one jurisdiction to another or may conflict with other rules or our practices. As a result, our practices may not have complied or may not comply in the future with all such laws, regulations, requirements and obligations.
We are also subject to non-U.S. privacy rules and regulations, such as the EU’s General Data Protection Regulation (“GDPR”), the European e-Privacy Regulation and national laws supplementing GDPR, the Data Protection Act of 2018 (“DPA 18”) in the United Kingdom, and the EU Privacy and Electronic Communications Regulation. GDPR and DPA 18 require companies to meet stringent requirements regarding the processing of personal data of individuals located in the European Economic Area (“EEA”). GDPR and DPA 18 also include significant penalties for noncompliance, which may result in monetary penalties of up to the higher of €20.0 million or 4% of a group’s worldwide revenue for the preceding financial year for the most serious violations. The GDPR, DPA 18, and other similar regulations require companies to give specific types of notice and informed consent is required for certain actions, and the GDPR also imposes additional conditions in order to satisfy such consent, such as bundled consents.
We cannot determine the impact any future laws, regulations and standards may have on our business. Complying with these evolving obligations is costly. Expanding definitions and interpretations of what constitutes “personal data” (or the equivalent) within the U.S., the EEA and elsewhere may increase our compliance costs and legal liability.
In addition, a significant data breach or any failure, or perceived failure, by us to comply with any federal, state or foreign privacy or consumer protection-related laws, regulations or other principles or orders to which we may be subject or other legal obligations relating to privacy or consumer protection could adversely affect our reputation, brand and business, and may result in claims, investigations, proceedings, litigation, or enforcement actions against us by governmental entities. This may result in penalties, liabilities or loss, increased compliance or operational costs, or otherwise require us to change our operations and/or cease using certain data sets. Depending on the nature of the information compromised, we may also have obligations to notify users, law enforcement or payment companies about the incident and may need to provide some form of remedy for the individuals affected by the incident.
We are subject to environmental regulation and may incur substantial costs.
We are subject to federal, state, local and foreign laws, regulations and ordinances relating to the protection of the environment, including those relating to emissions to the air, discharges to surface and subsurface waters, safe drinking water, greenhouse gases and the management of hazardous substances, oils and waste materials. Federal, state and local laws and regulations relating to the protection of the environment may require a current or previous owner or operator of real estate to investigate and remediate hazardous or toxic substances or petroleum product releases at or from the property. Under federal law, generators of waste materials, and current and former owners or operators of facilities, can be subject to liability for investigation and remediation costs at locations that have been identified as requiring response actions. Compliance with environmental laws and regulations can require significant expenditures. In addition, we could incur costs to comply with such current or future laws and regulations, the violation of which could lead to substantial fines and penalties.
We may have to pay governmental entities or third parties for property damage and for investigation and remediation costs that they incurred in connection with any contamination at our current and former facilities without regard to whether we knew of or caused the presence of the contaminants. Liability under these laws may be strict, joint and several, meaning that we could be liable for the costs of cleaning up environmental contamination regardless of fault or the amount of waste directly attributable to us. Even if more than one person may have been responsible for the contamination, each person covered by these environmental laws may be held responsible for all of the clean-up costs incurred. Environmental liabilities could arise and have a material adverse effect on our financial condition and performance. We do not believe, however, that pending environmental regulatory developments in this area will have a material effect on our capital expenditures or otherwise materially adversely affect its operations, operating costs, or competitive position.
Changes in tax laws or regulations may increase tax uncertainty and adversely affect results of our operations and our effective tax rate.
The Company is subject to taxes in the U.S. and certain foreign jurisdictions. Due to economic and political conditions, tax rates in various jurisdictions, including the U.S., may be subject to change. The Company’s future effective tax rates could be affected by changes in the mix of earnings in countries with differing statutory tax rates, changes in the valuation of deferred tax assets and liabilities and changes in tax laws or their interpretation. In addition, the Company may be subject to income tax audits by various tax jurisdictions. Although the Company believes its income tax liabilities are reasonably estimated and accounted for in accordance with applicable laws and principles, an adverse resolution by one or more taxing authorities could have a material impact on the results of its operations.
Certain U.S. state tax authorities may assert that we have a state nexus and seek to impose state and local income taxes, which could harm our results of operations.
There is a risk that certain state tax authorities where we do not currently file a state income tax return could assert that we are liable for state and local income taxes based upon income or gross receipts allocable to such states. States are becoming increasingly aggressive in asserting a nexus for state income tax purposes. If a state tax authority successfully asserts that our activities give rise to a nexus, we could be subject to state and local taxation, including penalties and interest attributable to prior periods. Such tax assessments, penalties and interest may adversely impact our results of operations.
If we cannot successfully protect our intellectual property, our business could suffer.
We rely on a combination of intellectual property rights, contractual protections, and other practices to protect our proprietary information, technologies and processes. We primarily rely on patent, copyright and trade secret laws to protect our proprietary technologies and processes, including the operations systems and technology we use throughout our business. Others may independently develop the same or similar technologies and processes or may improperly acquire and use information about our technologies and processes, which may allow them to provide products and services similar to ours, which could harm our competitive position. To the extent we pursue additional patent protection for our innovations, patents we may apply for may not issue, and patents that do issue or that we acquire may not provide us with any competitive advantages or may be challenged by third parties. There can be no assurance that any patents we obtain will adequately protect our inventions or survive a legal challenge, as the legal standards relating to the validity, enforceability, and scope of protection of patent and other intellectual property rights are uncertain. We may be
required to spend significant resources to monitor and protect our intellectual property rights, and the efforts we take to protect our proprietary rights may not be sufficient.
We rely in part on trade secrets, proprietary know-how and other confidential information to maintain our competitive position. Although we enter into confidentiality and invention assignment agreements with our employees and consultants, and enter into confidentiality agreements with the parties with whom we have strategic relationships and business relationships, no assurance can be given that these agreements will be effective in controlling access to and distribution of our proprietary information. Further, these agreements do not prevent our competitors from independently developing technologies that are substantially equivalent or superior to our technologies.
To protect our intellectual property rights, we may be required to spend significant resources to monitor and protect these rights, and we may or may not be able to detect infringement by third parties. Litigation may be necessary in the future to enforce our intellectual property rights and to protect our trade secrets. Such litigation could be costly, time consuming and distracting to management and could result in the impairment or loss of portions of our intellectual property. Furthermore, our efforts to enforce our intellectual property rights may be met with defenses, counterclaims and countersuits attacking the validity and enforceability of our intellectual property rights. Our inability to protect our proprietary technology against unauthorized copying or use, as well as any costly litigation or diversion of our management’s attention and resources, could delay future sales and introductions of new capabilities, result in our substituting inferior or more costly technologies into our business, or injure our reputation. In addition, we may be required to license additional technology from third parties to develop and market new capabilities, and we cannot assure you that we could license that technology on commercially reasonable terms or at all, and our inability to license this technology could harm our ability to compete.
Our technology may violate the proprietary rights of third parties, which could have a negative impact on our operations.
If any of our technology violates proprietary rights, including copyrights and patents, third parties may assert infringement claims against us. Certain software modules and other intellectual property used by us make use of or incorporate licensed software components and other licensed technology. These components are developed by third parties over whom we have no control. Any claims brought against us may result in limitations on our ability to use the intellectual property subject to these claims. We may be required to redesign our offerings or services or to obtain licenses from third parties to continue our offerings without substantially re-engineering such products or systems. Our intellectual property rights may be invalidated, circumvented, challenged, infringed or required to be licensed to others. An infringement or misappropriation could harm any competitive advantage we currently derive or may derive from our proprietary rights.
Risks Related to Financing and Ownership of our Securities
We have a substantial amount of debt. Our ability to operate is limited by the agreements governing our debt.
As of December 31, 2025, we had $88.4 million of total debt outstanding primarily related to the JPMorgan Credit Agreement and up to $35.0 million of additional borrowing capacity under our revolving credit facility of the Adams Street Credit Agreement. Subject to the limits contained in some of the agreements governing our outstanding debt, we may incur additional debt in the future. Our maintenance of higher levels of indebtedness could have adverse consequences including impairing our ability to obtain additional financing in the future
Our level of debt places significant demands on our cash resources, which could:
•make it more difficult to satisfy our outstanding debt obligations;
•require us to dedicate a substantial portion of our cash for payments related to our debt, reducing the amount of cash flow available for working capital, capital expenditures, entitlement of our real estate assets, contributions to our tax-qualified pension plan, and other general corporate purposes;
•limit our flexibility in planning for, or reacting to, changes in the industries in which we compete;
•place us at a competitive disadvantage with respect to our competitors, some of which have lower debt service obligations and greater financial resources than we do;
•limit our ability to borrow additional funds;
•limit our ability to expand our operations through acquisitions; and
•increase our vulnerability to general adverse economic and industry conditions.
If we are unable to generate sufficient cash flow to service our debt and fund our operating costs, our liquidity may be adversely affected.
We may require substantial additional funding to finance our operations, but adequate additional financing may not be available when we need it, on acceptable terms or at all.
Our primary sources of liquidity are cash flows provided by operations and access to existing credit facilities. Since inception, we have incurred net losses and have used our cash to fund capital expenditures, costs associated with our acquisitions, including the Edge Acquisition, and costs associated with becoming a public company, among other uses. We have and may continue to experience net cash outflows from operating activities as we continue to grow our business. As of December 31, 2025, our available liquidity totaled $129.5 million, which was comprised of $94.5 million in cash and cash equivalents, and $35.0 million in available borrowings from our existing credit facilities. Additionally, we had restricted cash of $0.7 million, consisting of performance guarantees which are legally restricted for withdrawal and use.
We believe that our existing sources of liquidity will be sufficient to meet our working capital needs for at least the next twelve months from the date on which our consolidated financial statements were issued. However, our current liquidity may not be sufficient to meet the required long-term liquidity needs, in addition to our other liquidity needs associated with our business strategies, capital expenditures, debt payments, and other corporate needs and investing and financing requirements. In the future, we could be required to raise capital through additional public or private financing or other arrangements. Such financing may not be available on acceptable terms, or at all, and our failure to raise capital when needed could harm our business. We may sell additional equity securities or debt securities in one or more transactions at prices and in a manner as we may determine from time to time. If we sell any such securities in subsequent transactions, our current investors could be materially diluted further. Any debt financing, if available, may involve restrictive covenants and could reduce our activities, operational flexibility or profitability. These restrictive covenants may also limit the amount of free cash flow available for future acquisitions, dividends, stock repurchases or other uses, and make us more vulnerable to economic or industry downturns, including interest rate increases, the impact of which could have a material adverse effect on our results of operations, financial condition and liquidity. If we cannot raise funds on acceptable terms, we may not be able to grow our business or respond to competitive pressures.
The Edge Acquisition and the issuance and sale of shares of our Series A Convertible Preferred Stock has reduced the relative voting power of holders of our common stock and diluted the ownership of holders of our capital stock.
Following completion of the Edge Acquisition, after giving effect to the related stock issuance, our offering of 16,125,100 shares of our common stock (the “June 2025 Offering”) and sales under our ATM (as defined below) facility (together with the June 2025 Offering and the Edge Acquisition, the “Transactions”), stockholders prior to the Transactions exercise significantly less influence over the Company after the Transactions relative to their respective influence over the Company prior to the Transactions, and thus have a less significant impact on the approval or rejection of future proposals submitted to a stockholder vote.
Additionally, on October 28, 2022 and November 3, 7 and 8, 2022, we issued an aggregate of 81,250 shares of Series A Convertible Preferred Stock (the “Convertible Preferred Stock”) to AE Industrial Partners Fund II, LP and AE Industrial Partners Structured Solutions I, LP, affiliates of AEI, and certain other investors (collectively, the “Investors”). There are currently 46,505.13 shares of Convertible Preferred Stock outstanding as a result of dividends paid-in-kind, the election by certain of the Investors to convert their Convertible Preferred Stock into shares of our common stock and the Company’s repurchase of certain other shares of Convertible Preferred Stock. The remaining shares of the Convertible Preferred Stock are immediately and currently convertible into approximately 15,583,454 shares of common stock and, on an as-converted basis represent approximately 8% of Redwire’s outstanding common stock assuming conversion of the Convertible Preferred Stock as of December 31, 2025. Shares of Convertible Preferred Stock vote as one class with our common stock, on an as-converted basis. Therefore, the issuance and sale of Convertible Preferred Stock resulted in the immediate and substantial dilution to the ownership interests of the holders of our common stock.
Following completion of the Transactions, AEI holds a significant share of the voting power of the Company and will appoint a majority of the directors to our Board.
As of December 31, 2025, AEI beneficially owned approximately 48.7% of our common stock and Convertible Preferred Stock (on an as converted to common stock basis). Additionally, among other things, an amended and restated investor rights agreement (the “A&R Investor Rights Agreement”) entered into by the Company, Ultimate Holdings, certain stockholders of the Company affiliated with AEI (the “AE Industrial Stockholders”) and Genesis Park Holdings provides that, of the nine or more directors that will sit on the Board, (i) the AE Industrial Stockholders will be permitted to designate four directors for election to the Board, which number would be reduced once the AE Industrial Stockholders no longer hold 50% or more of the our common stock beneficially owned by the AE Industrial Stockholders (excluding our common stock beneficially owned by Ultimate Holdings) at the closing of the Edge Acquisition and (ii) Ultimate Holdings will be permitted to designate one director for election to the Board so long as Ultimate Holdings continues to hold 25% or more of the common stock beneficially owned by Ultimate Holdings (excluding common stock beneficially owned by the AE Industrial Stockholders) at the closing of the Edge Acquisition, provided that so long as the AE Industrial Stockholders and Ultimate Holdings collectively may nominate an aggregate of five directors to the Board, all but one director must be independent under New York Stock Exchange (“NYSE”) listing standards and, if less than five directors, a majority must be independent.
AEI has significant influence over us, which could limit other investors’ ability to influence the outcome of key transactions.
As of December 31, 2025, AEI owns 46,505.13 shares of our Convertible Preferred Stock, which is currently convertible into approximately 15,583,454 shares of our outstanding common stock or approximately 8% of Redwire’s outstanding common stock assuming conversion of the Convertible Preferred Stock. The Convertible Preferred Stock votes with our common stock on an as-converted basis. Additionally, as of December 31, 2025, AEI owned 85,473,375 shares of our outstanding common stock and 2,000,000 of our private warrants and as of February 23, 2026, these amounts have reduced to 45,073,029 and 2,000,000, respectively.
We have the option to issue dividends payable on the Convertible Preferred Stock by issuing additional shares of Convertible Preferred Stock in satisfaction of such dividend (“PIK Dividend”) and in the future may satisfy any such dividends payable with respect to the Convertible Preferred Stock as PIK Dividends. As a result of the voting rights of the Convertible Stock and the degree of concentration of voting power (and the potential for such power to increase upon the purchase of additional stock and/or the payment of PIK Dividends), AEI has the ability to significantly influence the outcome of any matter submitted for the vote of the holders of our common stock, and as a result, your ability to elect members of our Board and influence our business and affairs, including any determinations with respect to mergers or other business combinations, the acquisition or disposition of assets, or the issuance of any additional common stock or other equity securities, is diminished.
In addition, AEI has representation on the Board and has significant control over the management and affairs of the Company. AEI may nominate designees to our Board as noted above. Circumstances may occur in which the interests of AEI could conflict with the interests of holders of other outstanding capital stock, including our common stock.
Additionally, as long as AEI continues to beneficially own at least 25% of the aggregate number of shares of Convertible Preferred Stock originally issued to them, we may not undertake certain actions without the prior approval of AEI. Prior to obtaining the approvals described by the foregoing, subject to certain exceptions, we must not: (1) create or authorize the creation of (including by increasing the authorized amount of) or issue any senior securities or parity securities or any securities convertible into or exercisable or exchangeable for any senior security or parity security, or amend or alter the Company’s Certificate of Incorporation to increase the number of authorized shares of Convertible Preferred Stock, (2) reclassify or modify any existing class or series of equity securities in a manner that would result in such class or series of equity securities being senior to or on parity with the Convertible Preferred Stock, (3) issue any shares of Convertible Preferred Stock in excess of 10% of the number of shares of Convertible Preferred Stock initially purchased by certain Investors, (4) decrease the number of authorized shares of Convertible Preferred Stock, (5) alter, change or amend the terms, rights, preferences or privileges of the Convertible Preferred Stock in any manner, (6) amend, waive, alter or repeal any provision of the Company’s Certificate of Incorporation, Bylaws or comparable organizational documents in a manner that would adversely affect the Convertible Preferred Stock or the rights, preferences or privileges of the Convertible Preferred Stock, (7) declare or pay a dividend or distribute cash or property through dividends or other distributions in respect of any junior securities, (8) redeem, purchase or otherwise acquire any junior securities, (9) create or hold any of the Company’s capital stock in any subsidiary that is not a wholly-owned subsidiary or dispose of any subsidiary capital stock or all or substantially all of any subsidiary’s assets, or (10) commence any voluntary liquidation, bankruptcy, dissolution, recapitalization, reorganization or assignment to the Company’s creditors. These restrictions may hinder our ability to execute on our growth strategy or prevent us from implementing parts of our business plan.
Further, from and after the seventh anniversary of the issuance of the Convertible Preferred Stock, for so long as AEI has record and beneficial ownership, in the aggregate and on an as-converted basis, at least equal to 50% of the number of shares of common stock issued to them, on an as-converted basis, as of the date of such issuance, AEI has the right to cause the Company to retain an investment banker to identify and advise the Company regarding opportunities for a company sale and participate on Company’s behalf in negotiations for, and to assist the Company in conducting, such company sale. The interests of AEI to encourage a company sale could conflict with the interests of holders of other outstanding capital stock, including our common stock.
Provisions in our Certificate of Designation (the “Certificate of Designation”) may delay or prevent our acquisition by a third party, which could also reduce the market price of our capital stock.
Certain rights of the holders of the Convertible Preferred Stock could make it more difficult or more expensive for a third party to acquire us. Holders of Convertible Preferred Stock have certain repurchase, preemptive, conversion and consent rights. These provisions may make it more costly for a potential acquirer to engage in a business combination transaction with us.
If any of certain fundamental changes were to occur, we or the surviving entity would be required to make an offer to repurchase, at the option and election of the holders thereof, for cash each share of Convertible Preferred Stock then outstanding. The repurchase price of the Convertible Preferred Stock is equal to the greater of (a) (i) 100% of the applicable accrued value as of the repurchase date plus (ii) if prior to October 28, 2027, the aggregate amount of all dividends that would have been paid in respect of an outstanding share of such series of Convertible Preferred Stock from the repurchase date through October 28, 2027 and (b) the amount that such holder would have received in such fundamental change with respect to such share of Convertible Preferred Stock if all shares of Convertible Preferred Stock had been converted into shares of common stock on the business day immediately prior to the effective
date of the relevant fundamental change. However, if in connection with a fundamental change the consideration received by holders of our common stock consists of cash and common stock meeting certain liquidity requirements of an issuer with a market capitalization greater than $600 million, then the repurchase price paid to the holders of Convertible Preferred Stock will consist of (a) cash in the amount of the applicable accrued value as of the repurchase date and (b) a number of shares of such common stock equal to the excess of the repurchase price such holder would have received in cash, as applicable, over such accrued value. These features of the Convertible Preferred Stock could increase the cost of acquiring us or otherwise discourage a third party from acquiring us or removing incumbent management. Provisions that have the effect of potentially discouraging, delaying or preventing such a transaction could limit the opportunity for our shareholders to receive a premium for their shares of our capital stock and could also affect the price that some investors are willing to pay for our capital stock.
Our Convertible Preferred Stock has rights, preferences and privileges that are not held by, and are preferential to, the rights of holders of our other outstanding capital stock.
In the event of any voluntary or involuntary liquidation, dissolution or winding up of our affairs, the holders of our Convertible Preferred Stock are entitled to receive certain payments (i) prior to any amounts paid to holders of our common stock and each other class or series of our capital stock now existing or hereafter authorized, the terms of which do not expressly provide that such class or series ranks either senior to, or on parity with, the Convertible Preferred Stock, and (ii) on parity with each other class or series of our capital stock established in the future, the terms of which expressly provide that such class or series ranks on a parity basis with the Convertible Preferred Stock. Therefore, in the event of our voluntary or involuntary liquidation, dissolution, or winding-up of our affairs, no distribution of our assets may be made to holders of our common stock until we have paid to holders of the Convertible Preferred Stock then outstanding the greater of (a) the greater of (i) two times the initial value of the shares of Convertible Preferred Stock and (ii) the accrued value of such shares of Convertible Preferred Stock as of the date of such liquidation and (b) the amount that such holder would have received with respect to such share of Convertible Preferred Stock based on its accrued value if all shares of Convertible Preferred Stock had been converted at their accrued value (regardless of whether they were actually converted and without regard to any limitations on convertibility or as to whether sufficient shares of common stock are available out of the Company’s authorized but unissued stock for the purpose of effecting such conversion) into shares of common stock on the business day immediately prior to the liquidation. However, in the event of a bankruptcy, liquidation, dissolution, or winding-up of our affairs, our assets will be available to pay obligations on the Convertible Preferred Stock only after all of our secured and unsecured indebtedness has been paid. This could reduce the remaining amount of our assets, if any, available to distribute to holders of our capital stock.
Our obligations to the holders of Convertible Preferred Stock could limit our ability to obtain additional financing or increase our borrowing costs, which could have an adverse effect on our financial condition. These preferential rights could also result in divergent interests between the holders of shares of our Convertible Preferred Stock and other holders of our capital stock.
There may be sales of a substantial amount of our common stock by our current shareholders, and these sales could cause the price of our common stock to fall.
As of December 31, 2025, there were 191,915,804 shares of our common stock outstanding. Substantially all of our issued and outstanding shares are freely transferable, except for any shares held by our “affiliates,” as that term is defined in Rule 144 under the Securities Act. Future sales of our common stock may cause the market price of our securities to drop significantly, even if our business is doing well.
We are party to the A&R Investor Rights Agreement, pursuant to which we filed a shelf registration statement registering the securities held by AEI, Genesis Park Holdings and the other parties thereto. Shareholders who are party to the A&R Investor Rights Agreement also have certain demand and “piggyback” registration rights with respect to the securities held by such parties. In addition, pursuant to the Registration Rights Agreements, dated October 28, 2022, by and among us and the Investors (the “Series A Registration Rights Agreement”) and the Registration Rights Coordination Agreement, dated as of June 8, 2025, by and among the Company, BCC Redwire Aggregator, L.P. and AEI (the “Registration Rights Coordination Agreement”), we filed a shelf registration statement to permit the public resale of the shares of common stock underlying the parties’ Convertible Preferred Stock, and each party also has additional demand and “piggyback” registration rights with respect to those shares.
Given that the above described shelf registrations have been filed pursuant to the A&R Investor Rights Agreement, Series A Registration Rights Agreement and the Registration Rights Coordination Agreement and each has been declared effective, the parties whose shares have been registered pursuant thereto and currently hold beneficial ownership over such shares may sell large amounts of our common stock in the open market or in privately negotiated transactions, which could have the effect of increasing the volatility in our stock price or putting significant downward pressure on the price of our common stock.
Sales of substantial amounts of our common stock in the public market or the perception that such sales will occur, could adversely affect the market price of our common stock and make it difficult for us to raise funds through securities offerings in the future.
We have adopted a two-segment reporting structure. Our two-segments are designated as Space and Defense Tech and have been in effect for a limited period of time. This change to segment reporting could be confusing to investors and may not have the desired effects.
Beginning with the year ended December 31, 2025, we began reporting as two separate segments. We have provided disclosures about our new segment reporting structure, but there is no guarantee that investors or the market will understand this change to our financial reporting. There is also no guarantee that this change will have the desired effect. Failure of investors or analysts to understand our revised segment reporting structure may negatively affect their ability to understand our business and operating results which could adversely affect our stock price.
The Company reorganized its segment structure to align with the strategic offerings of each business segment and the way the Chief Operating Decision Maker ("CODM") assesses performance and makes capital allocation decisions. As a result, we identified two reporting segments, our Space segment and our Defense Tech segment. These changes and our diversified operations have placed, and may continue to place, significant demands on our management and our operational and financial infrastructure. For example, our portfolio review and cost reduction activities, among other activities, have placed and will continue to place significant demands on our management team. Managing these changes has required, and may continue to require, significant expenditures and allocation of valuable management resources. If we fail to achieve the necessary level of efficiency in our organization as it changes, our business, financial condition and results of operations could be adversely impacted.
Risks Related to Being a Public Company
We may not be able to remain in compliance with the continued listing requirements of the NYSE, and if the NYSE delists our common stock, it would have an adverse impact on the trading, liquidity and market price of our common stock.
The Company’s common stock is listed on the NYSE under the symbol “RDW”. The price of our common stock may be adversely affected due to, among other things, our financial results and market conditions. There can be no assurance that we will continue to remain in compliance with the NYSE’s minimum price rule for our common stock or that we will remain in compliance with any of the other applicable continued listing standards of the NYSE.
Any failure to remain in compliance with the NYSE's continued listing standards, and any subsequent failure to timely resume compliance with the NYSE's continued listing standards within the applicable cure period, could have adverse consequences including, among others, reducing the number of investors willing to hold or acquire our common stock, reducing the liquidity and market price of our common stock, adverse publicity and a reduced interest in us from investors, analysts and other market participants. In addition, a suspension or delisting could impair our ability to raise additional capital through the public markets and our ability to attract and retain employees by means of equity compensation.
We may issue additional common stock or other equity securities which could dilute our shareholders’ ownership interests.
We may issue additional shares of common stock or other equity securities in the future in connection with, among other things, future acquisitions, repayment of outstanding indebtedness or grants under the Redwire Corporation 2021 Omnibus Incentive Plan without shareholder approval in a number of circumstances. Our issuance of additional common stock or other equity securities of equal or senior rank would have the following effects:
•our existing shareholders’ proportionate ownership interest will decrease;
•the amount of cash available per share, including for payment of dividends in the future, may decrease;
•the relative voting strength of each previously outstanding share of common stock may be diminished; and
•the market price of our common stock may decline.
A market for our common stock may not be sustained and the market price of our common stock and warrants has and may continue to fluctuate due to numerous circumstances beyond our control.
An active trading market for our common stock may not be sustained and the market price for our common stock has and may continue to be volatile, due to many factors, some of which may be beyond our control. Factors affecting the trading price of our common stock may include:
•actual or anticipated fluctuations in our quarterly financial results or the quarterly financial results of companies perceived to be similar to it;
•changes in the market’s expectations about our operating results;
•success of competitors;
•our operating results failing to meet market expectations in a particular period;
•changes in financial estimates and recommendations or comments by securities analysts or other third parties concerning us or the aerospace and defense industry and market in general;
•future announcements or press coverage concerning our business or our competitors’ businesses and the public’s reaction to such announcements, press coverage or releases, and filings with the SEC;
•operating and stock price performance of other companies that investors deem comparable to us;
•the size of our public float;
•“short squeezes” and meme-like trading of our common stock or the common equity of companies in our industry;
•our ability to market new and enhanced products on a timely basis;
•changes in laws and regulations affecting our business;
•commencement of, or involvement in, litigation involving us;
•changes in its capital structure, such as future issuances of securities or the incurrence of additional debt;
•the volume of shares of common stock available for public sale;
•any significant change in our board or management;
•sales of substantial amounts of common stock by our directors, executive officers or significant shareholders or the perception that such sales could occur; and
•general economic and political conditions such as recessions, interest rates, fuel prices, international currency fluctuations, tariff actions and acts of war or terrorism.
Broad market and industry factors may depress the market price of our common stock irrespective of our operating performance. The stock market in general and NYSE have experienced price and volume fluctuations that have often been unrelated or disproportionate to the operating performance of the particular companies affected. The trading prices and valuations of these stocks, and of our securities, may not be predictable. Volatility in the market price of our common stock may prevent investors from being able to sell their shares of common stock at or above their purchase price or at all and price volatility may be greater if the public float and trading volume of our common stock is low. A decline in the market price of our common stock also could adversely affect its ability to issue additional securities and its ability to obtain additional financing in the future.
Additionally, investors may purchase shares of our common stock to hedge existing exposure or to speculate on the price of our common stock. Speculation on the price of our common stock may involve long and short exposures. To the extent aggregate short exposure exceeds the number of shares of our common stock available for purchase on the open market, investors with short exposure may have to pay a premium to repurchase shares of our common stock for delivery to lenders of our common stock. Those repurchases may, in turn, dramatically increase the price of shares of our common stock until additional shares of our common stock are available for trading or borrowing. This is often referred to as a “short squeeze.”
A “short squeeze” could lead to volatile price movements in shares of our common stock that are unrelated or disproportionate to our operating performance or prospects and, once investors purchase the shares of our common stock necessary to cover their short positions, the price of our common stock may rapidly decline. Investors that purchase shares of our common stock during a short squeeze may lose a significant portion of their investment.
We do not anticipate paying dividends on our common stock for the foreseeable future.
We do not anticipate that our Board will declare dividends on our common stock in the foreseeable future. In addition, the ability of our Board to pay such dividend in the future may be restricted by our debt documents, our holding company structure and capital requirements at our subsidiaries. Because we do not pay dividends on our common stock, and do not anticipate paying dividends on our common stock for the foreseeable future, the price of our common stock must appreciate in order for you to realize a gain on your investment. This appreciation may not occur.
We identified material weaknesses in internal control over financial reporting. Until we remediate these material weaknesses or if we identify additional material weaknesses, we may not be able to accurately and timely report our financial results, in which case our business may be harmed and investors may lose confidence in the accuracy and completeness of our financial reports.
Our internal control over financial reporting is a process designed to provide reasonable assurance regarding the reliability of financial reporting and the preparation of financial statements for external reporting purposes in accordance with accounting principles generally accepted in the United States of America (“U.S. GAAP”). We identified material weaknesses in our internal control over financial reporting. A material weakness is a deficiency, or combination of deficiencies, in internal control over financial reporting,
such that there is a reasonable possibility that a material misstatement of our annual or interim consolidated financial statements will not be prevented or detected on a timely basis.
Material Weaknesses in Internal Control over Financial Reporting
A material weakness is a deficiency, or combination of deficiencies, in internal control over financial reporting, such that there is a reasonable possibility that a material misstatement of our annual or interim consolidated financial statements will not be prevented or detected on a timely basis.
Management identified the following material weaknesses in internal control over financial reporting as of December 31, 2025:
•For substantially all of our U.S. operations, we designed process-level control activities pervasive across our financial reporting processes, but were unable to fully deploy those process-level control activities with sufficient time to demonstrate their operating effectiveness.
•For European and remaining U.S. operations:
◦Due to insufficient time and resources, we did not (i) establish effective information technology (“IT”) general controls (“ITGCs”), specifically program change controls and access controls, that support the consistent operation of the Company’s IT operating systems, databases and IT applications, and end user computing over all financial reporting; and, ii) have policies and procedures through which ITGCs are deployed across the organization. Automated process-level controls and manual controls dependent upon the accuracy and completeness of information derived from IT systems were also rendered ineffective because they are affected by the lack of ITGCs.
◦As a result, we did not effectively design, implement or operate process-level control activities pervasive across our financial reporting processes.
The material weaknesses above did not result in a material misstatement to the consolidated financial statements as of and for the year ended December 31, 2025. However, the control deficiencies described above created a reasonable possibility that a material misstatement to the consolidated financial statements would not be prevented or detected on a timely basis.
Our independent registered public accounting firm, KPMG LLP, who audited the consolidated financial statements included in this Annual Report on Form 10-K, has also audited the effectiveness of our internal control over financial reporting as of December 31, 2025, and issued an adverse opinion on the effectiveness of our internal control over financial reporting. KPMG LLP’s report appears on page 62 of this Annual Report on Form 10-K.
Material Weaknesses in Excluded Acquired Business
In the second quarter of 2025, the Company acquired Redwire Defense Tech Intermediate Holdings, LLC. Prior to the acquisition, Redwire Defense Tech Intermediate Holdings, LLC’s management identified material weaknesses in its internal control over financial reporting, due to a lack of ITGCs and effective process-level control activities similar to those identified above related to the Company’s European and certain U.S. operations. These material weaknesses continue to exist as of December 31, 2025.
These material weaknesses did not result in any material misstatements to the consolidated financial statements as of and for the year ended December 31, 2025.
Management’s Remediation Plans
Management, with oversight from the Board of Directors, continues to implement a remediation plan to address the material weaknesses. The Company made progress during 2025 in its remediation of the material weaknesses as further described below.
•For substantially all of our U.S. operations we have designed and implemented both manual and automated process-level control activities but due to insufficient time and resources, were unable to demonstrate their operating effectiveness. We plan to do so, through testing, during 2026.
For our European and remaining U.S. operations, including Redwire Defense Tech Intermediate Holdings, LLC, we will continue our remediation efforts including:
•Implementing one enterprise resource planning (“ERP”) system for our European operations and expanding the implementation of our U.S. ERP system for our remaining U.S. operations.
•Continuing our engagement of a third-party global consulting firm to accelerate the deployment of ITGCs and manual and automated process-level controls across our financial reporting process.
•Continuing to assess the specific training needs of personnel and developing and delivering training programs designed to uphold our internal control standards.
We believe the above actions will be effective in remediating the material weaknesses described above. However, the material weaknesses cannot be considered remediated until remediated controls operate for a sufficient period of time and management has concluded, through testing, that these controls are operating effectively. Although we intend to complete the remediation of remaining processes as promptly as possible, we cannot at this time estimate how long it will take to remediate the material weaknesses described above. We may discover additional material weaknesses that require additional time and resources to remediate, and we may decide to take additional measures to address the material weaknesses or modify the remediation steps described above.
If we are unable to successfully remediate existing or any future material weaknesses in our internal control over financial reporting, the accuracy and timing of our financial reporting may be adversely affected, investors may lose confidence in our financial reporting, and/or we could become subject to litigation or investigations by the New York Stock Exchange (“NYSE”), the SEC or other regulatory authorities.
Item 1B. Unresolved Staff Comments
None.
Item 1C. Cybersecurity
Risk Management and Strategy
Redwire is committed to maintaining the trust and confidence of our stakeholders, which includes taking appropriate technical and organizational measures for maintaining information security and data privacy. Cybersecurity is critical to advancing our “Heritage plus Innovation” strategy and enabling our digital transformation efforts. We face a multitude of cybersecurity threats that range from attacks common to most industries, such as ransomware and denial-of-service, to attacks from more advanced and persistent, highly organized adversaries, including nation state actors, that target the defense industrial base and other critical infrastructure sectors. Our customers, suppliers, subcontractors and joint venture partners face similar cybersecurity threats, and a cybersecurity incident impacting us or any of these entities could materially adversely affect our operations, performance and results of operations. These cybersecurity threats and related risks make it imperative that we strive to be a leader in the information security field, and we expend considerable resources on cybersecurity.
Our corporate information technology department, which maintains our cybersecurity function, is led by our Chief Information Officer (“CIO”), who reports to our Chief Executive Officer (“CEO”). The Chief Information Security Officer (“CISO”) reports to the CIO and has direct access to the CEO regarding cybersecurity matters. The CISO is responsible for our Company’s information security strategy, policy, security engineering, operations and cyber threat detection and response. Our current CIO and CISO have extensive information technology, cybersecurity and project management experience. Our CIO was a cyber defense, operations and communications officer as a U.S. Navy information professional with over 20 years of experience. Our CISO has over 35 years in various information technology roles, including experience with three other public companies and is a certified information systems security professional (“CISSP”) and DoW information systems security manager. The CISO manages a team of cybersecurity professionals with broad experience and expertise, and have an average of over 15 years of experience in various roles involving information technology, including security and compliance. The corporate cybersecurity and compliance department manages and continually enhances our enterprise security structure with the ultimate goal of preventing cybersecurity incidents to the extent feasible, while simultaneously increasing our system resilience in an effort to minimize the business impact should an incident occur.
In order to assess, identify and manage information security and cybersecurity threats, the Company has implemented a cybersecurity program that includes risk assessment and prevention measures to facilitate communication, training, awareness and incident response procedures. These are integrated into our overall enterprise risk management (“ERM”) process. To the extent the ERM process identifies a heightened cybersecurity related risk, risk owners are assigned to develop risk mitigation plans, which are then tracked to completion. The ERM process’ annual risk assessment is presented to the Board.
The Company maintains policies and procedures to ensure timely and appropriate notifications to relevant parties and regulators as required for cybersecurity threats and data breaches. A designated incident response team is responsible for the execution of Redwire’s data breach response plan. Comprised of Company officers who serve across several functions, the incident response team includes the Company’s CISO, CIO, General Counsel, CFO, Cybersecurity Director and cybersecurity professionals or other employees from the Company’s information technology, finance, compliance and human resources functions support the incident response team, including with respect to diagnosing and mitigating cybersecurity events.
Our cybersecurity policies and frameworks are based on industry and governmental standards to align closely with DoW requirements, instructions and guidance. The Company has adopted the National Institute of Standards and Technology (“NIST”) Special Procedure (SP) 800-171, NIST Cybersecurity Framework and Zero Trust Framework. The NIST SP 800-171 is to ensure compliance for protecting controlled unclassified information for U.S. Government projects as contractually required. The NIST Cybersecurity
Framework models the best practices for security and the capabilities needed to identify, protect, detect and respond to cybersecurity risks and events, while the Zero Trust Framework addresses security challenges. The majority of the Company’s wholly owned subsidiaries are certified as Level 2 compliant under the U.S. DoW Cybersecurity Maturity Model Certification (CMMC). We evaluate our physical, electronic and administrative safeguards on a continuous basis to ensure they are effectively deployed across the business.
The Company has implemented multiple industry-leading cybersecurity tools as recognized by Gartner including: a Zero Trust Network Access that includes an Internet Intrusion detection and response combined with an always-on virtual private network solution to reduce our external exposure; Endpoint Detection & Response tools for endpoint protection; Security Incident & Event Management tool enabling collaborative information sharing across all tools to alert on incidents; and Unified Endpoint Management for inventory vulnerability management, real-time visibility and control. We employ threat protection firewalls at our facilities and perform network and vulnerability monitoring with industry leading tools. We utilize third-party tools to protect Redwire data and have implemented security and data protection technologies.
We also work with trusted and leading third parties to help us assess and strengthen our information security program. We engage third-party services to conduct evaluations of our security controls, whether through penetration testing, independent audits or consulting on best practices to address new challenges. These evaluations include testing both the design and operational effectiveness of security controls.
We have implemented controls designed to identify and mitigate cybersecurity threats associated with our use of third-party service providers. Such providers are subject to security risk assessments at the time of onboarding, contract renewal, and upon detection of an increase in risk profile. We use a variety of inputs in such risk assessments, including information supplied by providers and third parties. In addition, we require our providers to meet appropriate security requirements, controls and responsibilities and investigate security incidents that have impacted our third-party providers, as appropriate.
Similar to many other companies, we experience attempts to gain unauthorized access to our systems and information on a regular basis, and a number of our employees work remotely, which creates additional opportunities for cybercriminals to exploit vulnerabilities. Despite our security measures, including employee training, our information technology and infrastructure are vulnerable to cyber-attacks, malicious intrusions, breakdowns, destruction, loss of data privacy, breaches due to employee error, malfeasance or other disruptions and we may not be successful in preventing or mitigating a cybersecurity incident that could have a material adverse effect on our operations or financial results. See Item 1A. “Risk Factors” for further discussion of these risks.
Governance
The Company’s Board is responsible for the oversight of management’s process for identifying and mitigating risks, including cybersecurity risks. IT leadership of the Company briefs the Board on a quarterly basis regarding information security matters, including the current cybersecurity landscape, progress on information security initiatives and accomplishments, and an information security dashboard. The Board is apprised of cybersecurity incidents concluded to have a moderate or higher business impact, even if immaterial to us. In the event of an incident, we intend to follow our incident response process, which outlines the steps to be followed from incident detection to mitigation, recovery and notification, including notifying functional areas (e.g. legal), as well as senior leadership and the Board, as appropriate.
Item 2. Properties
We operate from 23 locations in North America and 5 locations in Europe consisting of offices, warehouses, service centers, laboratories and other facilities approximating 910,000 square feet as of December 31, 2025. The Company also retains use of additional storage and administrative space as needed to support operations, which are not included in the table below.
We lease all of our properties. The majority of leases are for varying term lengths up to fifteen years. Our locations range in size from approximately 1,200 to 158,600 square feet.
Our headquarters is located in Jacksonville, Florida, in proximity to major NASA and other space offices and operations. In North America we have five facilities in California, four facilities in Colorado, two facilities in Florida, Indiana, New Mexico, Michigan and Virginia, respectively, and one facility in Alabama, Massachusetts, Oregon and Ontario, respectively. In Europe, we have one facility in Latvia, Luxembourg, Poland, Ukraine and Belgium, respectively. Subsequent to December 31, 2025, we only have one facility in Indiana and Michigan, respectively. Each of these facilities is strategically located near major national security or civil space community facilities, key customer facilities, commercial space centers and/or prestigious engineering talent pools.
We believe that our properties are in good operating condition and believe the productive capacity of our properties is adequate to meet current contractual requirements and those for the foreseeable future. We may improve, replace or reduce facilities as considered appropriate to meet the needs of our operations. Our current facilities have supported the development of technology that is transforming the space industry, and the current footprint is sufficient to support near-term growth. However, as we continue to grow, we plan to continue and even accelerate the pace of leasehold improvements so that our facility capacity is not a limiting factor on our growth. Expansion and reconfiguration of our existing facilities are also being studied to support further growth and cost optimization in the future.
Item 3. Legal Proceedings
The Company is subject to litigation, claims, investigations and audits arising from time to time in the ordinary course of business. Although legal proceedings are inherently unpredictable, the Company believes that it has valid defenses with respect to any matters currently pending against the Company and intends to defend itself vigorously. Excluding pending matters referenced below, the outcome of these matters, individually and in the aggregate, is not expected to have a material impact on the Company’s consolidated financial statements.
For additional information on pending matters, please refer to Note M – Commitments and Contingencies of the accompanying notes to the consolidated financial statements. For further information on the risks associated with existing and future investigations, lawsuits, arbitration, claims, enforcement actions and other legal proceedings, please refer to Item 1A. “Risk Factors.”
Item 4. Mine Safety Disclosures
Not Applicable.
PART II
Item 5. Market for Registrant's Common Equity, Related Stockholder Matters and Issuer Purchases of Equity Securities
Market Information
Our common stock is listed on the NYSE and trades under the symbol “RDW”. As of February 23, 2026, there were 191,975,804 shares of common stock outstanding.
Holders
As of February 23, 2026, there were 15 holders of our common stock. These numbers do not include an estimate of the indeterminate number of beneficial holders whose shares and warrants may be held by brokerage firms and clearing agencies.
Dividends
We have never declared dividends on our common stock and we do not anticipate paying cash dividends in the foreseeable future. Any decisions to declare and pay dividends in the future will be made at the discretion of our Board and will depend on, among other things, our results of operations, financial condition, cash requirements, contractual restrictions and other factors that our Board may deem relevant.
Recent Sales of Unregistered Securities; Use of Proceeds from Registered Offerings
During 2025, in accordance with the Convertible Preferred Stock Certificate of Designation, the Company issued 8,068.27 and 3,311.52 shares of Convertible Preferred Stock to holders of record as of April 15, 2025 and October 15, 2025, respectively, as a dividend paid-in-kind on the Convertible Preferred Stock. The issuance is exempt from registration under the Securities Act of 1933, as amended, pursuant to Section 4(a)(2) thereof.
Purchases of Equity Securities by the Issuer and Affiliated Purchasers
None.
Stock Performance Graph
Not applicable.
Item 6. [Reserved]
Item 7. Management’s Discussion and Analysis of Financial Condition and Results of Operations
The following Management’s Discussion and Analysis is intended to assist in an understanding of our financial condition and results of operations for fiscal 2025 compared with fiscal 2024 items. Discussions of fiscal 2023 items and year-to-year comparisons between fiscal 2024 and fiscal 2023 that are not included in this Form 10-K can be found in “Management’s Discussion and Analysis of Financial Condition and Results of Operations” in the Company’s Annual Report on Form 10-K for the fiscal year ended December 31, 2024 filed with the SEC on March 11, 2025.
The following discussion and analysis is provided as a supplement to, and should be read in conjunction with, the consolidated financial statements and accompanying notes included in this Annual Report on Form 10-K. Certain information contained in this discussion and analysis includes forward-looking statements that involve risks and uncertainties. Our actual results may differ materially from those anticipated in these forward-looking statements as a result of many factors. For information identifying important factors that could cause actual results to differ materially from those anticipated in the forward-looking statements, please refer to Item 1A. “Risk Factors” and the “Cautionary Note Regarding Forward-Looking Statements” sections of this Annual Report on Form 10-K. Unless the context otherwise requires, all references in this section to the “Company,” “Redwire,” “we,” “us” or “our” refer to Redwire Corporation and its consolidated subsidiaries.
Business Overview
Redwire is an integrated space and defense technology company focused on advanced technologies including space infrastructure, autonomous systems and multi-domain operations leveraging digital engineering and artificial intelligence automation. Redwire’s proven and reliable space and defense technology capabilities include our space and defense technology and platform offerings of
avionics, sensors, and payloads; power generation; structures and mechanisms; radio frequency systems; airborne and spacecraft platforms and missions; and microgravity payloads. Redwire combines decades of flight heritage and proven experience with an agile and innovative culture.
Redwire’s primary business model is providing proven, mission critical solutions based on space and defense technology offerings through both short- and long-duration projects for U.S. and international government and commercial customers. Redwire operates in two business segments: Space and Defense Tech. We organize our business segments based on the nature of the products and services offered.
Redwire’s Space segment focuses on delivering next-generation spacecraft, large space infrastructure, and microgravity capabilities to serve civil, national security, and commercial space customers globally. Our core space offerings are flight-proven and have supported hundreds of spacecraft, missions, and operations, including, but not limited to, the International Space Station, the European Space Agency’s (“ESA”) Project for On-Board Autonomy (“PROBA”), the National Aeronautics and Space Administration’s (“NASA”) Double Asteroid Redirection Test and the Orion space capsule, and the Space Force’s GPS. We are also a provider of innovative technologies with the potential to help transform the economics of space and create new markets for its exploration and commercialization.
Redwire’s Defense Tech segment focuses on delivering combat-proven autonomous systems, optical sensors, advanced optics, resilient energy solutions and radio frequency payloads that provide intelligence, surveillance, and reconnaissance capabilities for customers including the U.S. Department of War (“DoW”, formerly known as the Department of Defense), U.S. Federal Civilian Agencies and allied governments across multiple domains. Our defense technology offerings include field-proven airborne products and services that have decades of innovation and more than 400 thousand flight hours. Key operations include developing and manufacturing Uncrewed Aerial Systems (“UAS”) for commercial, government, and military applications in areas such as surveillance, logistics, reconnaissance, border security, and emergency response. Redwire is committed to delivering innovative space and airborne platforms to help transform the future of multi-domain operations.
Recent Developments
Selected operational developments for the year ended December 31, 2025 are described below.
•Strengthened leadership in Very Low Earth Orbit (“VLEO”) with the award of a $44 million phase 2 contract to advance the Defense Advanced Research Projects Agency’s Otter mission, which leverages Redwire’s SabreSat.
•Entered into an eight-figure agreement with The Exploration Company (“TEC”) to provide two International Berthing and Docking Mechanisms (“IBDM”) to support autonomous rendezvous and docking capabilities for TEC’s Nyx spacecraft.
•Launched 14 PIL-BOXes, studying 18 unique molecules, to the International Space Station (“ISS”); as of December 31, 2025, Redwire had eleven active payload facilities on the ISS.
•Completed acquisition of Edge Autonomy, a leading provider of field-proven uncrewed aerial systems (“UAS”) on June 13, 2025.
•Delivered more than 100 Stalker/Penguin UAS to customers in 7 countries around the world subsequent to the Edge Autonomy acquisition, including the U.S. Army (directly and via the Long Range Reconnaissance (“LRR”) program), U.S. Marine Corps, NATO and other allied nations.
•Opened a new 85,000 square foot facility in Ann Arbor, Michigan to increase production of critical fuel cells to meet growing demand, reflecting a key investment in a domestic, vertical integration strategy for Stalker UAS production.
Industry and Regulatory Updates
U.S. Budget Environment
On March 15, 2025, the President signed into law the Full-Year Continuing Appropriations and Extensions Act of 2025 (PL 119-4), which extended federal funding (including for the U.S. Department of War (“DoW”), formerly referred to as the Department of Defense) at near fiscal year (“FY”) 2024 levels through September 30, 2025, but included an increase of $6 billion to defense spending, with NASA held approximately flat at FY 2024 budget levels of roughly $24.9 billion. Although the full-year continuing resolution offered budget continuity through September 2025, its flat funding and lack of detail on appropriation levels constrained agencies’ procurement efforts to make new awards.
In May 2025, the FY 2026 President’s budget request (“PBR”) proposed reducing NASA’s funding from approximately $24.9 billion to $18.8 billion. The proposal included cuts to the International Space Station operations, Lunar Gateway, the Mars Sample Return program, retiring SLS/Orion after Artemis IV, and several space science initiatives. As part of the “One Big Beautiful Bill” (“OBBB”) passed in July 2025, Congress included a supplemental appropriations package that restored approximately $10 billion in NASA
funding. The package provided continued funding for the Artemis missions, Lunar Gateway, International Space Station operations, and infrastructure projects at Johnson Space Center, while leaving certain proposed cuts to science programs in place. On January 23, 2026, the President signed into law $24.4 billion in FY 2026 appropriations for NASA. The combination of both the OBBB and the FY 2026 NASA appropriations enacted into law resulted in a significant increase for a total of $27.5 billion for FY 2026 for NASA. Additionally, on December 18, 2025, Jared Isaacman was sworn in as NASA’s 15th administrator.
On December 18, 2025, Congress passed, and the President signed into law, the National Defense Authorization Act of 2026 (“NDAA”, P.L. 119-60), authorizing annual funding levels for the U.S. Armed Forces and setting expenditures for the DoW. The FY 2026 NDAA authorized a total of $900.6 billion for national defense. The bill also authorized funding and updated U.S. national missile defense policy to reflect the goals of the “Golden Dome for America” initiative.
On February 3, 2026, Congress passed, and the President signed into law, the Consolidated Appropriations Act of 2026, that includes full FY 2026 appropriations for most of the federal government, exclusive of the Department of Homeland Security, which remains under a short-term continuing resolution. The bill provided $839.2 billion in total discretionary defense funding, including research and development funding. The bill includes $13.4 billion in funding for missile defense and space programs to augment and integrate in support of the “Golden Dome for America” initiative.
International Developments
In March 2025, the European Commission introduced the Readiness 2030 package (previously dubbed “ReArm Europe”), to deploy nearly €800 billion over four years for collective defense, including drone systems, missile defense, cyber and autonomous platforms. The package includes a suspension of fiscal constraints allowing up to 1.5% of Gross Domestic Product (“GDP”) to be put toward additional defense spending and launched the €150 billion Safe Action for Europe (“SAFE”) loan facility.
The SAFE fund, formally established in May 2025, is a new European Union (“EU”) financial instrument that is expected to increase defense spending among member states through common procurement. It will be financed by EU borrowing, with the European Commission authorized to issue up to €150 billion in loans. This funding is intended to strengthen the European Defence Technological and Industrial Base by facilitating joint investments in defense capabilities. EU contracts under SAFE will require greater than 65% of value tied to member-state supply chains. Since October 2025, Member States have continued to prepare and submit SAFE-related plans and requests, and public reporting indicates demand for SAFE financing has exceeded the initial €150 billion envelope, which could result in additional financing mechanisms or follow-on programs.
At the June 2025 North Atlantic Treaty Organization summit in The Hague, member states committed to raising combined defense and security spending to 5% of GDP by 2035—including a 3.5% core defense floor, and up to 1.5% in broader security or industrial base investment – up from the prior 2% target.
The European Space Agency’s 2025 budget is approximately €7.7 billion, with continued investment in human and robotic missions, Earth observation, navigation, and telecom infrastructure.
The European Commission formally introduced the EU Space Act in June 2025 as a proposed regulation to harmonize legal frameworks across the EU for space activities. It establishes a single market for space service providers and applies to EU and non-EU operators whose activities impact the EU internal market. The regulatory structure will be focused on three areas: safety (including orbital debris mitigation and space situational awareness), resilience (including space-based cybersecurity), and sustainability (including in-orbit servicing). If enacted by the European Parliament and Council, the regulation is designed to apply from January 1, 2030, with a two‑year transition period for existing missions not yet launched by that date. Since October 2025, Council-level work on the proposed EU Space Act has continued, including circulation of updated compromise text. The proposal remains subject to negotiation and may be modified, delayed, or otherwise revised prior to adoption.
In October 2025, the European Commission and European External Action Service announced additional details of the Readiness 2030 package mentioned above with the release of the “Preserving Peace - Defence Readiness Roadmap 2030”, which is a European Union plan to strengthen Europe's defense capabilities by 2030. The roadmap focuses on increasing defense spending and production, joint procurement efforts, and closing capability gaps. The plan enumerates four flagship projects: the European Drone Defence Initiative, the Eastern Flank Watch, the European Air Shield, and the European Space Shield. The roadmap also aims to establish a unified military mobility area by 2027 to allow for swift troop and equipment movement. Specific funding levels will depend on member state commitments and joint investments.
U.S. and international government spending levels and timely funding thereof may adversely affect our financial condition and operating performance over the short and long term. Please refer to Item 1A. “Risk Factors” included in this Annual Report on Form 10-K, for additional information related to government funding risks.
Geopolitical Environment
We operate in a complex and evolving global space and defense environment and our business is affected by geopolitical issues. Russia’s invasion of Ukraine significantly elevated global geopolitical tensions and security concerns, and following the acquisition of Edge Autonomy, a portion of the combined company’s sales are to customers in Ukraine. Those sales have been declining and may continue to decline in the event that the war and hostilities in Ukraine end, decline or change, or as a result of changes in international support for military assistance to Ukraine.
Results of Operations
We manage and assess our business based on performance on short- and long-term duration contracts, which involves the design, development and manufacturing of our offerings and related activities with varying delivery schedules. Therefore, the results of operations for a particular year, or year-over-year comparison may not be indicative of future operating results. Substantially all of our contracts in the Space segment and a portion of our contracts in the Defense Tech segment are accounted for under the percentage-of-completion cost-to-cost method. As a result, revenues on contracts are recorded over time based on progress towards completion for a particular contract, including the estimate of the profit to be earned at completion. The following discussion of material changes in consolidated revenues should be read in tandem with the subsequent discussion of changes in consolidated cost of sales because changes in revenues are typically accompanied by a corresponding change in cost of sales due to the nature of the percentage-of-completion cost-to-cost method.
Net EAC Adjustments
We record changes in costs estimated at completion (net EAC adjustments) using the cumulative catch-up method of accounting. Net EAC adjustments can have a significant effect on reported revenues and gross profit and the table below presents the aggregate amounts for the following periods:
| | | | | | | | | | | | | | | | | | | | | |
| | | Year Ended |
| (dollars in thousands) | | | | | December 31, 2025 | | December 31, 2024 | | December 31, 2023 |
Gross favorable | | | | | $ | 12,552 | | | $ | 12,062 | | | $ | 11,805 | |
Gross unfavorable | | | | | (67,005) | | | (29,758) | | | (15,327) | |
Total net EAC adjustments | | | | | $ | (54,453) | | | $ | (17,696) | | | $ | (3,522) | |
The Company evaluates the contract value and cost estimates at completion for performance obligations no less frequently than quarterly, and more frequently when circumstances significantly change. Changes in contract estimates occur for a variety of reasons including, but not limited to, changes in contract scope, labor productivity, the nature and technical complexity of the work to be performed, availability and cost volatility of materials, subcontractor and vendor performance, volume assumptions, inflationary trends, and schedule and performance delays. We utilize information available to us at the time when revising our estimates and apply consistent judgment across the full portfolio of programs. The net unfavorable EAC adjustments in 2025 were primarily due to a $25.2 million unfavorable adjustment, including a $12.9 million loss reserve related to a program in the Company’s Defense Tech segment and $14.1 million unfavorable adjustments related to programs in the Space Europe reporting unit as a result of an increase in estimates made for the programmatic and technical assumptions based on the nature and technical complexity of the work to be performed to meet customer specifications. Refer to Note P – Revenues of the accompanying notes to the consolidated financial statements for additional information.
Results of operations for the year ended December 31, 2025 compared to the year ended December 31, 2024:
| | | | | | | | | | | | | | | | | | | | | | | | | | | | | | | | | | | | | |
| | | | | | | | | | | |
| | | | | | | | | Year Ended | | $ Change from prior year period | % Change from prior year period | | | |
| (in thousands, except percentages) | | | | | | | | | December 31, 2025 | % of revenues | | December 31, 2024 | % of revenues | | | | |
| Revenues | | | | | | | | | $ | 335,381 | | 100 | % | | $ | 304,101 | | 100 | % | | $ | 31,280 | | 10 | % | | | |
| Cost of sales | | | | | | | | | 318,096 | | 95 | | | 259,646 | | 85 | | | 58,450 | | 23 | | | | |
| Gross profit | | | | | | | | | 17,285 | | 5 | | | 44,455 | | 15 | | | (27,170) | | (61) | | | | |
| Operating expenses: | | | | | | | | | | | | | | | | | | | |
| Selling, general and administrative expenses | | | | | | | | | 171,280 | | 51 | | | 71,398 | | 23 | | | 99,882 | | 140 | | | | |
| | | | | | | | | | | | | | | | | | | |
| Transaction expenses | | | | | | | | | 21,236 | | 6 | | | 9,129 | | 3 | | | 12,107 | | 133 | | | | |
| | | | | | | | | | | | | | | | | | | |
| Impairment expense | | | | | | | | | 34,685 | | 10 | | | — | | — | | | 34,685 | | 100 | | | | |
| Research and development | | | | | | | | | 19,761 | | 6 | | | 6,128 | | 2 | | | 13,633 | | 222 | | | | |
| Operating income (loss) | | | | | | | | | (229,677) | | (68) | | | (42,200) | | (14) | | | (187,477) | | 444 | | | | |
| | | | | | | | | | | | | | | | | | | |
| Interest expense, net | | | | | | | | | 39,704 | | 12 | | | 13,483 | | 4 | | | 26,221 | | 194 | | | | |
| Loss on extinguishment of debt | | | | | | | | | 996 | | — | | | — | | — | | | 996 | | 100 | | | | |
| Other (income) expense, net | | | | | | | | | (18,811) | | (6) | | | 60,648 | | 20 | | | (79,459) | | (131) | | | | |
| Income (loss) before income taxes | | | | | | | | | (251,566) | | (75) | | | (116,331) | | (38) | | | (135,235) | | 116 | | | | |
| Income tax expense (benefit) | | | | | | | | | (25,014) | | (7) | | | (2,020) | | (1) | | | (22,994) | | 1138 | | | | |
| Net income (loss) | | | | | | | | | (226,552) | | (68) | | | (114,311) | | (38) | | | (112,241) | | 98 | | | | |
| Net income (loss) attributable to noncontrolling interests | | | | | | | | | — | | — | | | 4 | | — | | | (4) | | (100) | | | | |
| Net income (loss) attributable to Redwire Corporation | | | | | | | | | $ | (226,552) | | (68) | % | | $ | (114,315) | | (38) | % | | $ | (112,237) | | 98 | % | | | |
Revenues
Revenues increased by $31.3 million, or 10%, for the year ended December 31, 2025, as compared to the year ended December 31, 2024. The year-over-year increase in revenues was primarily related to $107.1 million of revenue related to the Edge Autonomy acquisition. This increase was partially offset by $41.1 million of net unfavorable EAC adjustments for the year ended December 31, 2025 as compared to $17.7 million of net unfavorable EAC adjustments for the same period in 2024. Please refer to Note P – Revenues of the accompanying notes to the consolidated financial statements for additional information related to the Company’s net EAC adjustments. The increase is also partially offset due to timing in the stage of production cycles year-over-year for certain larger contracts for power generation offerings in the Space segment. The foregoing resulted in decreased volume of production and therefore decreased revenue compared to the same period in 2024.
Cost of Sales
Cost of sales increased $58.5 million, or 23%, for the year ended December 31, 2025, as compared to the year ended December 31, 2024. The year-over-year increase in cost of sales was primarily driven by $70.1 million of costs related to the Edge Autonomy acquisition, including non-cash expense of $13.6 million related to the purchase accounting fair value adjustment to inventory for the inventory on-hand at the Edge Autonomy acquisition date that was subsequently sold, which is non-recurring. The increase is also due to $13.4 million of increases in contract loss reserves recognized during the year ended December 31, 2025 for which there were nominal comparable amounts in 2024. These increases were partially offset by reduced costs due to a shift in the production cycle associated with certain larger contracts in power generation offerings described above.
Gross Profit and Margin
Gross profit decreased $27.2 million, or 61%, for the year ended December 31, 2025, as compared to the year ended December 31, 2024. As a percentage of revenues, gross margin was 5% and 15% for the years ended December 31, 2025 and 2024, respectively. The year-over-year decrease in gross margin as a percentage of revenues was driven by a $54.5 million negative impact of net EAC adjustments for the year ended December 31, 2025, as compared to $17.7 million of net unfavorable EAC adjustments for the same period in 2024. Gross profit and gross margin were also adversely impacted by the non-cash expense of $13.6 million related to the purchase accounting fair value adjustment associated with the Edge Autonomy acquisition as described above. Please refer to Note P – Revenues of the accompanying notes to the consolidated financial statements for additional information related to the Company’s net EAC adjustments.
Selling, General and Administrative (“SG&A”) Expenses
SG&A expenses increased $99.9 million for the year ended December 31, 2025, as compared with the same period in 2024. SG&A expenses as a percentage of revenues also increased to 51% for the year ended December 31, 2025 from 23% during the same period in 2024. The year-over-year increase in SG&A expenses was primarily driven by an increase in share-based compensation of $47.1 million, including $44.4 million related to the Edge Incentive Units, for which there was no comparable cost in 2024. The increase is also due to $48.5 million in SG&A expenses, other than equity-based compensation, related to Edge Autonomy for which there is no comparable cost in 2024. The increase is also partially due to an increase in labor related costs, including severance, intangible amortization and professional fees.
Transaction Expenses
Transaction expenses increased $12.1 million primarily due to costs incurred related to the Edge Autonomy acquisition for the year ended December 31, 2025, as compared with the same period in 2024. Please refer to Note C – Business Combinations of the accompanying notes to the consolidated financial statements for additional information related to acquisitions.
Impairment Expense
The Company recognized impairment expense of $34.7 million for the year ended December 31, 2025, for which there was no comparable expense in the same period of 2024. During the fourth quarter of 2025, the Company performed its annual quantitative goodwill and long-lived asset impairment tests and recorded a non-cash, pre-tax and post-tax impairment charge of $34.7 million. $2.6 million of this amount related to property, plant and equipment, $10.9 million related to intangible assets, and $20.9 million related to goodwill. Please refer to Note F, Note G, and Note H of the accompanying notes to the consolidated financial statements for additional information related to impairment.
Research and Development
Research and development expenses increased $13.6 million for the year ended December 31, 2025 as compared with the same period in 2024 primarily due to $14.9 million of costs related to the Edge Autonomy acquisition.
Interest Expense, net
Interest expense, net increased $26.2 million for the year ended December 31, 2025, as compared to the year ended December 31, 2024. This increase was primarily related to $20.0 million of interest expense recognized related to the repayment of the Seller Note (as defined below). The increase is also partially due to interest on the new JPMorgan Credit Agreement entered into during the year ended December 31, 2025, as well as an increase in borrowings on the Adams Street revolving credit facility compared to 2024. Please refer to Note I – Debt of the accompanying notes to the consolidated financial statements for additional information related to the Company’s debt obligations.
Loss on Extinguishment of Debt
The Company recognized $1.0 million as a loss on extinguishment of debt related to the write-off of unamortized discount and deferred financing costs associated with the term loans and revolving credit facility under the Adams Street Credit Agreement as a result of the early re-payment on the related loans. Please refer to Note I – Debt of the accompanying notes to the consolidated financial statements for additional information related to the Company’s debt obligations.
Other (Income) Expense, net
Other (income) expense, net decreased by $79.5 million for the year ended December 31, 2025, from net expense to net income as compared to the year ended December 31, 2024. This year-over-year change was primarily due to a gain of $16.1 million recognized as a result of a decrease in the fair value of the Company’s private warrant liability for the year ended December 31, 2025 compared to a loss of $52.0 million recognized during the same period in 2024. The change is also due to a decrease in expense of $8.0 million due to a legal settlement recognized during the year ended December 31, 2024 for which there was no comparable activity in the current year. Please refer to Note D – Fair Value of Financial Instruments of the accompanying notes to the consolidated financial statements for additional information related to the Company’s private warrants.
Income Tax Expense (Benefit)
The table below provides information regarding our income tax expense (benefit) for the following periods:
| | | | | | | | | | | | | | | | | | |
| | | | | | | | |
| | | | | Year Ended | | | |
| (in thousands, except percentages) | | | | | December 31, 2025 | | December 31, 2024 | | | |
| Income tax expense (benefit) | | | | | $ | (25,014) | | | $ | (2,020) | | | | |
| Effective tax rate | | | | | (9.9) | % | | (1.7) | % | | | |
The effective tax rate changed to (9.9)% for the year ended December 31, 2025 as compared to (1.7)% for the year ended December 31, 2024, primarily related to the Company’s realization of deferred tax assets as a result of the acquisition of Edge Autonomy. Please refer to Note L – Income Taxes of the accompanying notes to the consolidated financial statements for additional information.
Net Income (Loss) Attributable to Noncontrolling Interests
The Company had no net income (loss) attributable to noncontrolling interests for the year ended December 31, 2025 and a de minimis amount for the same period in 2024.
Business Segment Results of Operations
As of December 2025, we operate in two business segments: Space and Defense Tech. We organize our business segments based on the nature of products and services offered and based on the financial information that is provided and regularly reviewed by the CODM in deciding how to allocate resources and in assessing performance.
Revenues, gross profit and operating profit of our business segments exclude inter-segment sales, cost of sales and profit as these activities are eliminated in consolidation and thus are not included in management’s evaluation of performance of each segment.
Business segment operating profit excludes a portion of corporate costs not considered allowable or allocable to contracts, and other items not considered part of management’s evaluation of segment operating performance.
Revenues, cost of sales and operating profit for each of our business segments were as follows (in millions):
| | | | | | | | | | | | | | | | | |
(in thousands) | 2025 | | 2024 | | 2023 |
Revenues | | | | | |
Space | $ | 209,817 | | | $ | 255,336 | | | $ | 194,000 | |
Defense Tech | 125,564 | | | 48,765 | | | 49,800 | |
Total revenues | $ | 335,381 | | | $ | 304,101 | | | $ | 243,800 | |
Cost of sales | | | | | |
Space | 202,482 | | | 222,927 | | | 149,298 | |
Defense Tech | 115,614 | | | 36,719 | | | 36,533 | |
Total cost of sales | $ | 318,096 | | | $ | 259,646 | | | $ | 185,831 | |
Operating income (loss) | | | | | |
Space | $ | (49,155) | | | $ | 16,099 | | | $ | 27,621 | |
Defense Tech | (93,553) | | | 8,549 | | | 9,168 | |
Total business segment operating income (loss) | (142,708) | | | 24,648 | | | 36,789 | |
Unallocated items | | | | | |
Corporate charges | 65,848 | | | 57,725 | | | 52,324 | |
Transaction expenses | 21,121 | | | 9,123 | | | 13 | |
| | | | | |
Total unallocated, net | 86,969 | | | 66,848 | | | 52,337 | |
Total consolidated operating income (loss) | $ | (229,677) | | | $ | (42,200) | | | $ | (15,548) | |
Corporate charges mainly consists of corporate overhead costs maintained at the corporate level. These expenses include costs relating to treasury, accounting, consulting, advisory, legal, tax and audit, insurance, financial reporting services and various administrative expenses related to the corporate headquarters.
Space
Redwire’s Space segment focuses on delivering next-generation spacecraft; large space infrastructure; critical avionics, as well as microgravity capabilities to serve civil, national security, and commercial space customers. Space’s operating results included the
following:
| | | | | | | | | | | | | | | | | |
(in thousands) | 2025 | | 2024 | | 2023 |
Revenues | $ | 209,817 | | | $ | 255,336 | | | $ | 194,000 | |
Operating income (loss) | $ | (49,155) | | | $ | 16,099 | | | $ | 27,621 | |
Operating margin | (23) | % | | 6 | % | | 14 | % |
| | | | | |
| | | | | |
| | | | | |
| | | | | |
| | | | | |
| | | | | |
Space segment revenues decreased by $45.5 million, or 18%, for the year ended December 31, 2025, as compared to the year ended December 31, 2024. The year-over-year decrease in revenues was primarily related to $28.1 million of net unfavorable EAC adjustments for the year ended December 31, 2025 as compared to $15.3 million of net unfavorable EAC adjustments for the same period in 2024. The decrease in revenues is also due to timing in the stage of production cycles year-over-year for certain larger contracts related to power generation offerings.
Operating income (loss) decreased by $65.3 million for the year ended December 31, 2025, as compared to the year ended December 31, 2024. Operating margin also decreased from 6% to (23)% year-over-year. The decrease in operating income (loss) and margin is primarily due to the increase in unfavorable EAC adjustments recognized during the year ended December 31, 2025 and $34.4 million of impairment expense recognized related to the Space Europe reporting unit during the year ended December 31, 2025. Please refer to Note F, Note G, and Note H of the accompanying notes to the consolidated financial statements for additional information related to impairment.
Defense Tech
Redwire’s Defense Tech segment focuses on delivering combat-proven autonomous systems, optical sensors and radio frequency payloads that provide intelligence, surveillance, and reconnaissance capabilities for U.S. and allied nations across multiple domains. Defense Tech’s operating results included the following:
| | | | | | | | | | | | | | | | | |
| (in thousands) | 2025 | | 2024 | | 2023 |
Revenue | $ | 125,564 | | | $ | 48,765 | | | $ | 49,800 | |
Operating income (loss) | $ | (93,553) | | | $ | 8,549 | | | $ | 9,168 | |
Operating margin | (75) | % | | 18 | % | | 18 | % |
| | | | | |
| | | | | |
| | | | | |
| | | | | |
| | | | | |
| | | | | |
Defense Tech segment revenues increased by $76.8 million, or 157%, for the year ended December 31, 2025, as compared to the year ended December 31, 2024. The year-over-year increase in revenues was primarily due to $107.1 million of revenue related to the Edge Autonomy acquisition. This increase was partially offset by $12.9 million of net unfavorable EAC adjustments for the year ended December 31, 2025 as compared to $2.4 million of net unfavorable EAC adjustments for the same period in 2024.
Operating income (loss) decreased by $102.1 million for the year ended December 31, 2025, as compared to the year ended December 31, 2024. Operating margin also decreased from 18% to (75)% year-over-year. The decrease in operating income (loss) and operating margin is primarily due to an increase of $44.4 million related to the Edge Incentive Units, a non-cash expense of $13.6 million related to the purchase accounting fair value adjustment to inventory for the inventory on-hand at the Edge Autonomy acquisition date that was subsequently sold, which is non-recurring, and a $20.2 million increase in depreciation and amortization as a result of the Edge Acquisition. The decrease is also partially due to $25.8 million of net unfavorable EAC adjustments, inclusive of a $12.8 million increase in loss reserve recognized during the year ended December 31, 2025 as compared to $2.4 million of net unfavorable EACs during the year ended December 31, 2024.
Supplemental Non-GAAP Information
We use Adjusted EBITDA to evaluate our operating performance, generate future operating plans, and make strategic decisions, including those relating to operating expenses and the allocation of internal resources which are not calculated in accordance with U.S. Generally Accepted Accounting Principles (“U.S. GAAP”) and are considered to be Non-GAAP financial performance measures. These Non-GAAP financial performance measures are used to supplement the financial information presented on a U.S. GAAP basis and should not be considered in isolation or as a substitute for the relevant U.S. GAAP measures and should be read in conjunction with information presented on a U.S. GAAP basis. Because not all companies use identical calculations, our presentation of Non-GAAP measures may not be comparable to other similarly titled measures of other companies.
Adjusted EBITDA is defined as net income (loss) adjusted for interest expense, net, income tax expense (benefit), depreciation and amortization, impairment expense, transaction expenses, acquisition integration costs, acquisition earnout costs, purchase accounting fair value adjustment related to deferred revenue and inventory, severance costs, capital market and advisory fees, disposal of long-
lived assets, litigation-related expenses, equity-based compensation, committed equity facility transaction costs, debt financing costs and extinguishment losses, gains on sale of joint ventures, net of costs incurred, and warrant liability change in fair value adjustment.
The table below presents a reconciliation of Adjusted EBITDA to net income (loss), computed in accordance with U.S. GAAP for the following periods:
| | | | | | | | | | | | | | | | | | | | | |
| | | Year Ended |
| (in thousands) | | | | | December 31, 2025 | | December 31, 2024 | | December 31, 2023 |
| Net income (loss) | | | | | $ | (226,552) | | | $ | (114,311) | | | $ | (27,264) | |
| Interest expense, net | | | | | 39,704 | | | 13,483 | | | 10,699 | |
| Income tax expense (benefit) | | | | | (25,014) | | | (2,020) | | | (486) | |
| Depreciation and amortization | | | | | 32,639 | | | 11,692 | | | 10,724 | |
| Impairment expense | | | | | 34,685 | | | — | | | — | |
| Transaction expenses (i) | | | | | 21,236 | | | 9,129 | | | 13 | |
| Acquisition integration costs (i) | | | | | 2,602 | | | 609 | | | 546 | |
| | | | | | | | | |
| | | | | | | | | |
| Purchase accounting fair value adjustment (ii) | | | | | 13,645 | | | — | | | 15 | |
Severance costs (iii) | | | | | 3,789 | | | 867 | | | 313 | |
| Capital market and advisory fees (iv) | | | | | 6,856 | | | 6,703 | | | 8,607 | |
| Disposal of long-lived assets (v) | | | | | 647 | | | — | | | — | |
| Litigation-related expenses (vi) | | | | | 1,496 | | | 11,011 | | | 1,235 | |
| Equity-based compensation (vii) | | | | | 58,990 | | | 11,326 | | | 8,658 | |
| Committed equity facility transaction costs (viii) | | | | | — | | | — | | | 259 | |
| Debt financing costs and extinguishment losses (ix) | | | | | 1,101 | | | — | | | 17 | |
| Gain on sale of joint ventures, net of costs incurred (x) | | | | | — | | | (1,255) | | | — | |
| Warrant liability change in fair value adjustment (xi) | | | | | (16,109) | | | 51,960 | | | 2,011 | |
| Adjusted EBITDA | | | | | $ | (50,285) | | | $ | (806) | | | $ | 15,347 | |
| | | | | | | | | |
| | | | | | | | | |
i.Redwire incurred acquisition costs including due diligence, integration costs and additional expenses related to pre-acquisition activity. Acquisition deal costs was reclassified as Transaction expenses to conform with current period presentation.
ii.Redwire adjusted inventory in 2025 related to the application of purchase accounting for the Edge Autonomy acquisition and recognized expense for the amount of the fair value adjustment included in cost of sales for the inventory sold after the acquisition date. During 2023, Redwire recorded adjustments related to the impact of recognizing deferred revenue at fair value as part of the purchase accounting for previous acquisitions.
iii.Redwire incurred severance costs related to separation agreements entered into with former employees.
iv.Redwire incurred capital market and advisory fees related to advisors assisting with transitional activities associated with becoming a public company, such as the implementation of internal controls over financial reporting, and the internalization of corporate services, including, but not limited to, implementing enhanced enterprise resource planning systems.
v.Redwire incurred a loss on the disposal of long-lived assets.
vi.Redwire incurred expenses related to securities litigation and settlements of legal matters. Refer to Note M – Commitments and Contingencies of the accompanying notes to the consolidated financial statements for additional information.
vii.Redwire incurred expenses related to equity-based compensation under Redwire’s equity-based compensation plan and Edge Incentive Units.
viii.Redwire incurred expenses related to the committed equity facility with B. Riley during 2023, which includes changes in fair value recognized as a gain or loss during the respective periods.
ix.Redwire incurred expenses related to debt financing agreements, including amendment related fees paid to third parties that are expensed in accordance with U.S. GAAP, and losses on debt extinguishments. Refer to Note I – Debt of the accompanying notes to the consolidated financial statements for additional information.
x.Redwire recognized a gain related to the sale of all its ownership in two joint ventures during 2024, presented net of transaction costs incurred.
xi.Redwire adjusted the private warrant liability to reflect changes in fair value recognized as a gain or loss during the respective
periods.
Key Performance Indicators
The following Key Performance Indicators (“KPIs”) are used by Management to assess the financial performance of the Company, monitor relevant trends and support financial, operational and strategic decision-making. Management frequently monitors and evaluates KPIs against internal targets, core business objectives as well as industry peers and may, on occasion, change the mix or calculation of KPIs to better align with the business, its operating environment, standard industry metrics, or other considerations. If the Company changes the method by which it calculates or presents a KPI, prior period disclosures would be recast to conform to current presentation.
Book-to-Bill
Our book-to-bill ratio was as follows for the periods presented:
| | | | | | | | | | | | | | | | | | | | | |
| | | Last Twelve Months Ended |
| (in thousands, except ratio) | | | | | December 31, 2025 | | December 31, 2024 | | December 31, 2023 |
| Contracts awarded | | | | | | | | | |
Space | | | | | $ | 237,761 | | | $ | 184,370 | | | $ | 258,961 | |
Defense Tech | | | | | 203,717 | | | 45,419 | | | 41,081 | |
Total contracts awarded | | | | | $ | 441,478 | | | $ | 229,789 | | | $ | 300,042 | |
| Revenues | | | | | | | | | |
Space | | | | | $ | 209,817 | | | $ | 255,336 | | | $ | 194,000 | |
Defense Tech | | | | | 125,564 | | | 48,765 | | | 49,800 | |
Total revenues | | | | | $ | 335,381 | | | $ | 304,101 | | | $ | 243,800 | |
| Book-to-bill ratio | | | | | | | | | |
Space | | | | | 1.13 | | 0.72 | | 1.33 |
Defense Tech | | | | | 1.62 | | 0.93 | | 0.82 |
Total book-to-bill ratio | | | | | 1.32 | | 0.76 | | 1.23 |
Book-to-bill is the ratio of total contracts awarded to revenues recorded in the same period. The contracts awarded balance includes firm contract orders, including time-and-material (“T&M”) contracts, awarded during the period and does not include unexercised contract options or potential orders under indefinite delivery/indefinite quantity contracts. Although the contracts awarded balance reflects firm contract orders, terminations, amendments, or contract cancellations may occur which could result in a reduction to the contracts awarded balance.
We view book-to-bill as an indicator of future revenue growth potential. To drive future revenue growth, our goal is for the level of contracts awarded in a given period to exceed the revenue recorded, thus yielding a book-to-bill ratio greater than 1.0.
Our book-to-bill ratio was 1.32 for the Last Twelve Months (“LTM”) ended December 31, 2025, as compared to 0.76 for the LTM ended December 31, 2024. For the LTM ended December 31, 2025, contracts awarded includes $73.7 million of acquired contract value from the Edge Autonomy acquisition, which was completed in the second quarter of 2025. For the LTM ended December 31, 2024, contracts awarded includes $21.9 million of acquired contract value from the Hera Systems acquisition, which was completed in the third quarter of 2024. For the LTM ended December 31, 2023, none of the contracts awarded balance relates to acquired contract value.
Backlog
The following table presents our contracted backlog as of December 31, 2025 and 2024, and related activity for the year ended December 31, 2025 as compared to the year ended December 31, 2024:
| | | | | | | | | | | | | |
| | | |
| (in thousands) | December 31, 2025 | | December 31, 2024 | | |
| Organic backlog, beginning balance | $ | 296,652 | | | $ | 372,790 | | | |
| Organic additions during the period | 257,318 | | | 229,789 | | | |
| Organic revenue recognized during the period | (228,267) | | | (304,101) | | | |
| Foreign currency translation | 7,987 | | | (1,826) | | | |
| Organic backlog, ending balance | 333,690 | | | 296,652 | | | |
| | | | | |
| Acquisition-related contract value, beginning balance | — | | | — | | | |
| Acquisition-related contract value acquired during the period | 73,716 | | | — | | | |
| Acquisition-related additions during the period | 110,444 | | | — | | | |
| Acquisition-related revenue recognized during the period | (107,114) | | | — | | | |
| Foreign currency translation | 510 | | | — | | | |
| Acquisition-related backlog, ending balance | 77,556 | | | — | | | |
| | | | | |
| Contracted backlog, ending balance | $ | 411,246 | | | $ | 296,652 | | | |
| | | | | |
| | | | | |
| | | | | |
Contracted backlog by segment: | | | | | |
Space | $ | 299,804 | | | $ | 263,996 | | | |
Defense Tech | 111,442 | | | 32,656 | | | |
We view growth in backlog as a key measure of our business growth. Contracted backlog represents the estimated dollar value of firm funded executed contracts for which work has not been performed (also known as the remaining performance obligations on a contract). Our contracted backlog includes $81.0 million and $16.7 million in remaining contract value from contracts which recognize revenue at a point in time as of December 31, 2025 and 2024, respectively.
Organic backlog change excludes backlog activity from acquisitions for the first four full quarters since the entities’ acquisition date. Contracted backlog activity for the first four full quarters since the entities’ acquisition date is included in acquisition-related contracted backlog change. After the completion of four fiscal quarters, acquired entities are treated as organic for current and comparable historical periods.
Organic contract value includes the remaining contract value as of January 1 not yet recognized as revenue and additional orders awarded during the period for those entities treated as organic. Acquisition-related contract value includes remaining contract value as of the acquisition date not yet recognized as revenue and additional orders awarded during the period for entities not treated as organic. Organic revenue includes revenue earned during the period presented for those entities treated as organic, while acquisition-related revenue includes the same for all other entities, excluding any pre-acquisition revenue earned during the period. The acquisition-related backlog activity presented in the table above is related to the Edge Autonomy acquisition completed during the second quarter of 2025.
Although contracted backlog reflects business associated with contracts that are considered to be firm, terminations, amendments or contract cancellations may occur, which could result in a reduction in our total backlog. In addition, some of our multi-year contracts are subject to annual funding. Management expects all amounts reflected in contracted backlog to ultimately be fully funded. Contracted backlog from international operations was $193.1 million and $70.5 million as of December 31, 2025 and 2024, respectively. These amounts are subject to foreign exchange rate translations from their respective local currencies to U.S. dollars that could cause the remaining backlog balance to fluctuate with the foreign exchange rate at the time of measurement.
Liquidity and Capital Resources
Our operations are primarily funded with cash flows provided by operating activities, proceeds from the exercise of warrants and equity offerings, and access to existing credit facilities. As of December 31, 2025, we had $94.5 million in cash and cash equivalents and $35.0 million in available borrowings from our existing credit facilities.
Our primary requirements for liquidity and capital are for the Company’s material cash requirements, including working capital needs, satisfaction of our indebtedness and contractual commitments, investment in expanding our breadth and footprint through acquisitions
as well as investment in facilities, equipment, technologies, and research and development for our growth initiatives and general corporate needs.
Our ability to fund our cash needs is dependent upon the successful execution of our business strategy and future operating results. Our future operating results are subject to, among others, general economic conditions, including as a result of heightened inflation, rising interest rates and supply chain pressures, competitive dynamics in our target markets as well as legislative and regulatory factors that may be outside of our control. As part of our business and debt management strategy, we continuously evaluate opportunities to further strengthen our financial and liquidity position, including issuing additional equity or debt securities, refinancing or otherwise restructuring our existing credit facilities, or entering into new financing arrangements. There can be no assurance that any of these actions will be sufficient to allow us to adequately service our debt obligations, meet our debt covenants, or that such actions will not result in an adverse impact on our business. In the event that we require additional financing, we may not be able to secure such financing on terms acceptable to us or at all. For further information, please refer to Item 1A “Risk Factors” contained in this Annual Report on Form 10-K.
We believe our existing sources of liquidity will be sufficient to meet our working capital needs and debt service obligations and to comply with our debt covenants for at least the next twelve months from the date on which our consolidated financial statements were issued.
Indebtedness
Please refer to Note I – Debt of the accompanying notes to the consolidated financial statements for additional information related to the Company’s debt obligations.
Off-Balance Sheet Arrangements
From time to time, we are a party to certain off-balance sheet arrangements, such as standby letters of credit. Liabilities related to these arrangements are generally not reflected in our consolidated balance sheets. We do not expect any material impact on our cashflows, results of operations or financial condition to result from these off-balance sheet arrangements.
As of December 31, 2025 and 2024, we had $0.7 million and $15.4 million of standby letters of credit, respectively. Our standby letters of credit outstanding generally relate to submitted proposals and performance guarantees, which are secured by our restricted cash. Refer to Note B of the accompanying notes to the consolidated financial statements for additional information related to the Company’s restricted cash.
Contractual Obligations
The following table presents our contractual obligations as of December 31, 2025:
| | | | | | | | | | | | | | | | | | | | | | | | | | | | | | | | | | | | | | | | | |
| 2026 | | 2027 | | 2028 | | 2029 | | 2030 | | Thereafter | | Total |
| | | | | | | | | | | | | |
| | | | | | | | | | | | | |
| | | | | | | | | | | | | |
| | | | | | | | | | | | | |
JPMorgan Term Loan | $ | 4,500 | | | $ | 83,250 | | | $ | — | | | $ | — | | | $ | — | | | $ | — | | | $ | 87,750 | |
Other Financing Loan | 662 | | | — | | | — | | | — | | | — | | | — | | | 662 | |
| | | | | | | | | | | | | |
| Total long-term debt maturities | 5,162 | | | 83,250 | | | — | | | — | | | — | | | — | | | 88,412 | |
| Future minimum operating lease payments | 7,052 | | | 8,120 | | | 6,419 | | | 5,265 | | | 5,478 | | | 16,872 | | | 49,206 | |
| Future minimum finance lease payments | 716 | | | 624 | | | 429 | | | 237 | | | 124 | | | — | | | 2,130 | |
| Total contractual obligations | $ | 12,930 | | | $ | 91,994 | | | $ | 6,848 | | | $ | 5,502 | | | $ | 5,602 | | | $ | 16,872 | | | $ | 139,748 | |
During the year ended December 31, 2025, the Company entered into a lease agreement in Huntsville, Alabama, the construction of which is anticipated to be completed during fiscal year 2026. As of December 31, 2025, the lease has not yet commenced but created significant future lease obligations in the amount of $12.3 million. The lease was determined to be an operating lease, whereby the Company is not required to make rent payments prior to the lease commencement dates while construction is being completed on the underlying assets. Due to the nature of the work and the amount of the Company’s contribution to the construction period costs for the lease, the Company has determined it is not the owner of the assets under construction as the landlord has substantially all of the construction period risks.
Cash Flows
The table below summarizes certain information from the consolidated statements of cash flows for the following periods:
| | | | | | | | | | | | | | | | | |
| | | |
| Year Ended |
| (in thousands) | December 31, 2025 | | December 31, 2024 | | December 31, 2023 |
Cash, cash equivalents and restricted cash at beginning of year | $ | 49,071 | | | $ | 30,278 | | | $ | 28,316 | |
| Operating activities: | | | | | |
| Net income (loss) | (226,552) | | | (114,311) | | | (27,264) | |
Reconciling adjustments to net income (loss) | 101,245 | | | 75,006 | | | 21,700 | |
| Changes in working capital | (52,024) | | | 21,957 | | | 6,795 | |
Net cash provided by (used in) operating activities | (177,331) | | | (17,348) | | | 1,231 | |
Net cash provided by (used in) investing activities | (175,071) | | | (7,199) | | | (8,327) | |
Net cash provided by (used in) financing activities | 397,496 | | | 43,716 | | | 9,060 | |
Effect of foreign currency rate changes on cash, cash equivalents and restricted cash | 1,018 | | | (376) | | | (2) | |
Net increase (decrease) in cash, cash equivalents and restricted cash | 46,112 | | | 18,793 | | | 1,962 | |
Cash, cash equivalents and restricted cash at end of period | $ | 95,183 | | | $ | 49,071 | | | $ | 30,278 | |
Operating activities
Net cash used in operating activities increased by $160.0 million year-over-year. The change was primarily due to an increase in cash used by working capital of $74.0 million and an increase of $112.2 million in cash used related to the Company’s net loss, partially offset by an increase of $26.2 million in the effects of reconciling adjustments to net income (loss) for the year ended December 31, 2025 in comparison to 2024. The increase in cash used by working capital was primarily due to a decrease of $34.0 million in deferred revenue for 2025 compared to an increase of $3.2 million in deferred revenue for 2024 and a decrease in cash provided by accounts receivable and other liabilities of $17.0 million and $3.4 million, respectively, year-over-year. The decreases in other liabilities were primarily a result of timing of payments and recognition of liability. The changes in accounts receivable and deferred revenue were primarily driven by the timing of billable milestones during the year ended December 31, 2025 compared to 2024. The increase in non-cash adjustments is primarily related to increases in depreciation and amortization expense of $20.9 million, share-based compensation of $47.7 million and recognition of the inventory purchase accounting fair value adjustment of $13.6 million, all of which are primarily related to the Edge Autonomy acquisition. These increases were partially offset by a gain recognized on the change in fair value of the outstanding private warrants of $16.1 million during the year ended December 31, 2025 compared to loss of $52.0 million recognized in 2024 and an increase in the deferred tax benefit of $23.1 million year-over-year. Please refer to Note D – Fair Value of Financial Instruments and Note L – Income Taxes of the accompanying notes to the consolidated financial statements for additional information related to the fair value of warrants and income taxes.
Investing activities
Net cash used in investing activities increased by $167.9 million year-over-year. The change was primarily due to cash used to complete the Edge Autonomy acquisition, and an increase in capital expenditures primarily related to software licensed for internal-use. The increase in cash used in investing activities was also due to proceeds received during the year ended December 31, 2024 related to the sale of joint ventures for which there is no comparable activity in the current period.
Financing activities
Net cash provided by financing activities increased by $353.8 million during the year ended December 31, 2025, as compared to 2024. The change was primarily due to an increase in net proceeds received from the issuance of common stock through the ATM facility, equity offerings, and exercise of the Company’s public and private warrants of $518.4 million during the year ended December 31, 2025, for which there was nominal activity for the same period in 2024. The increase was partially offset by net repayments of debt in the amount of $43.0 million during the year ended December 31, 2025, compared to net proceeds of $37.1 million in the same period in 2024, and the repurchase of the Company’s Series A Convertible Preferred Stock of $63.9 million, for which there was no comparable activity for the same period in 2024. The change to net repayments of debt was driven primarily by the repayment of all outstanding principal balances of the term loans and revolving credit facility under the Adams Street Credit Agreement and the repayment of the Seller Note which is partially offset by proceeds from the JPMorgan Credit Agreement. Please refer to Note I – Debt of the accompanying notes to the consolidated financial statements for additional information related to the Company’s debt obligations.
Foreign Currency Exposures
Our operations in Europe conduct transactions that are primarily denominated in euros, which limits our foreign currency exposure. However, changes in exchange rates will affect the Company’s consolidated financial statements as expressed in U.S. dollars.
Critical Accounting Policies and Estimates
Our consolidated financial statements are prepared in conformity with U.S. GAAP, which requires us to make estimates, assumptions and judgments that affect the amounts reported in our consolidated financial statements and accompanying notes to the consolidated financial statements. For the critical accounting estimates used in preparing our consolidated financial statements, we make assumptions and judgments that can have a significant impact on net revenues, cost and expenses, and other (income) expense, net, in our consolidated statements of operations and comprehensive income (loss), as well as, on the value of certain assets and liabilities on our consolidated balance sheets. We base our assumptions, judgments and estimates on historical experience and various other factors that we believe are reasonable under the circumstances. Actual results could differ materially from these estimates under different assumptions or conditions.
We believe the following accounting policies are the most critical to the understanding of our consolidated financial statements and require the use of significant management judgment. For a summary of our significant accounting policies, please refer to Note B – Summary of Significant Accounting Policies of the accompanying notes to the consolidated financial statements.
Goodwill, Intangible and Long-lived Assets
Overview
The Company allocates the purchase price of an acquired business to the underlying tangible and identifiable intangible assets acquired and liabilities assumed based on their estimated fair values at acquisition date, with the excess recorded as goodwill. Identifiable finite-lived intangible assets from acquired businesses primarily consist of technology, trademarks, and customer relationships. The accounting for business combinations requires us to make significant estimates and assumptions, especially with respect to goodwill, intangible assets, and contingent consideration, which can be affected by contract performance and other factors over time. This may cause final amounts to differ materially from original estimates. Adjustments to the fair value of purchased assets and liabilities after the initial measurement period are recognized in net earnings.
Impairment Testing
The Company assesses goodwill and indefinite-lived intangible assets for impairment annually for impairment as of October 1st, or more frequently if events or circumstances indicate the carrying value may be impaired. Such events or circumstances may include, but are not limited to:
•deterioration in overall economic conditions;
•failure to reach our internal forecasts could impact our ability to achieve our forecasted levels of cash flows;
•adverse technological events that could impact our performance;
•volatility in equity and debt markets resulting in higher discount rates; and
•significant adverse changes in the regulatory environment or markets in which we operate.
Our goodwill and indefinite-lived intangible assets are allocated to and tested for impairment at the reporting unit level, which is defined as an operating segment or one level below an operating segment. As of the Company’s annual assessment date, October 1, 2025, the Company had six reporting units, Mission Solutions, Space Components, Engineering Services, Space Europe, Airborne U.S. and Airborne Europe, which were determined based on similar economic characteristics, financial metrics and product and servicing offerings. Effective December 2025, in connection with the change in operating segments, the Company reassessed its reporting units and identified six reporting units, Space Mission Solutions, Space US, Space Europe, Space Defense Tech, North America Defense Tech, and Europe Defense Tech. We may use both qualitative and quantitative approaches when testing goodwill and indefinite-lived intangible assets for impairment. In circumstances where a qualitative analysis indicates that the fair value of a reporting unit does not exceed its carrying value, a quantitative analysis is performed using an income approach.
When performing a quantitative analysis, the fair value of the Company’s reporting units are generally determined using a combination of an income approach based on a discounted cash flow (“DCF”) model as well as a market approach based on guideline public company revenues and earnings before interest, tax, depreciation and amortization multiples. Determining the fair value requires the exercise of significant judgments, including the amount and timing of expected future cash flows, long-term growth rates, discount rates and relevant comparable public company earnings multiples and relevant transaction multiples. The cash flows employed in the DCF analysis are based on the Company best estimate of future revenues, gross margins, operating expenses, and
cash flows with consideration for other factors, such as general market conditions, U.S. and foreign government budgets, existing contracted and uncontracted backlog, subcontractor agreements, changes in working capital, long-term business plans and historical operating performance. These estimates and judgments are based upon information available at the time and have been deemed reasonable by management as of the measurement date. The discount rates utilized in the DCF model are based on the respective reporting unit’s weighted average cost of capital (“WACC”), which takes into account the relative weights of debt and equity components within the Company’s existing capital structure and represents the expected cost of new capital, adjusted as appropriate to consider the risk inherent in future cash flows of the respective reporting unit. Actual results could differ from these assumptions.
During 2024 and 2023, the Company performed its annual impairment tests for each of our reporting units and concluded there were no indicators that the fair value was more likely than not below carrying value. Therefore, no quantitative assessment was performed and no goodwill impairment was recognized during 2024 and 2023, respectively.
During 2025, the Company performed a quantitative assessment for its annual impairment test for each of our reporting units and concluded that the fair value for the Space Europe reporting unit was below its carrying value. Therefore, the Company recognized $20.9 million of goodwill impairment during 2025. Please refer to Note H – Goodwill of the accompanying notes to the consolidated financial statements for further information.
Finite-lived intangible assets and long-lived assets are amortized to expense over their estimated useful life on a straight-line basis or over the period the economic benefits of the intangible asset are consumed. The Company evaluates its intangible and long-lived assets for impairment when events or changes in circumstances indicate that the carrying value of an asset or asset group may be impaired. If events or changes in circumstances indicate that the carrying value of an asset or asset group may be impaired, the sum of the undiscounted expected future cash flows of the asset or asset group are compared to the asset or asset group’s carrying value. If the asset or asset group’s carrying value exceed the sum of undiscounted cash flows, the Company records an impairment loss equal to the excess of carrying amount over the estimated fair value of the asset or asset group.
During 2024 and 2023, the Company identified no triggering events and therefore, no impairment assessment was performed on its intangible and long-lived assets. During 2025, the Company identified a triggering event related to the Space Europe reporting unit due to margin erosion and declining cash flows. As such, the Company performed an impairment assessment on the reporting unit’s asset groups and concluded that the undiscounted cash flows were below the carrying value of the asset group and, therefore, recognized $13.5 million of impairment during 2025. Please refer to Note F – Property, Plant and Equipment, net and Note G – Intangible Assets, net of the accompanying notes to the consolidated financial statements for further information regarding impairment recognized for long-lived assets and finite-lived intangible assets, respectively.
Revenue Recognition
The Company engages in short- and long-term contracts, including firm fixed-price (“FFP”), cost-plus fixed fee (“CPFF”) and T&M for production and service activities. Revenue from T&M contracts is recognized based on the number of direct labor hours expended in the performance of a contract multiplied by the contract billing rate. The Company recognizes revenue for performance obligations satisfied at shipment or delivery at a point-in-time and for performance obligations satisfied over time using the cost-to-cost method. Substantially all of the Company’s contracts in the Space segment and a portion of its contracts in the Defense Tech segment relate to contracts for performance obligations that create an asset with no alternative use to the Company and an enforceable right to payment for performance completed to date. The portion of the payments retained by the customer or advance payment is not considered a significant financing component because it is used to facilitate inventory demands at the onset of a contract and to safeguard the Company from the failure of the other party to abide by some or all of their obligations under the contract.
Under the cost-to-cost method, revenue is recognized based on the proportion of total costs incurred to total estimated costs-at-completion (“EAC”). An EAC includes all direct costs and indirect costs directly attributable to a program or allocable based on our program cost pooling arrangements. Estimates regarding the Company’s cost associated with the design, manufacture and delivery of products and services are used in determining the EAC.
We prepare EACs for our FFP and CPFF contracts and calculate estimated revenues and costs over the life of our contracts. Accounting for long-term contracts requires significant judgment relative to estimating total contract revenues and costs, in particular, assumptions relative to the amount of time to complete the contract, including the assessment of the nature and complexity of the work to be performed. The Company’s estimates are based upon the professional knowledge and experience of its engineers, program managers and other personnel, who review each long-term contract monthly to assess the contract’s schedule, performance, technical matters and EAC. Factors considered in these estimates include our historical performance, the availability, productivity and cost of labor, the nature and complexity of work to be performed, availability and cost of materials, components and subcontracts, the risk and impact of delayed performance and the level of indirect cost allocations. Changes in estimates are retrospectively applied and when adjustments in estimated contract costs are identified, such revisions may result in current period adjustments to earnings applicable to
performance in prior periods. When total EACs on a contract exceed the total revenue, a provision for the entire loss is determined at the contract level and is recorded in the period in which the loss is evident.
Item 7A. Quantitative and Qualitative Disclosures About Market Risk
The Company is a smaller reporting company and is not required to provide the information required under this Item 7A.
Item 8. Financial Statements and Supplementary Data
INDEX TO CONSOLIDATED FINANCIAL STATEMENTS
| | | | | |
| Page |
| |
| |
| |
| |
| |
| |
| |
| |
Note A – Description of the Business | |
Note B – Summary of Significant Accounting Policies | |
Note C – Business Combinations | |
Note D – Fair Value of Financial Instruments | |
| |
Note E – Inventory, net | |
Note F – Property, Plant and Equipment, net | |
Note G – Intangible Assets, net | |
Note H – Goodwill | |
Note I – Debt | |
Note J – Leases | |
Note K – Warrants and Capital Stock Transactions | |
Note L – Income Taxes | |
Note M – Commitments and Contingencies | |
Note N – Convertible Preferred Stock | |
Note O – Shareholders’ Equity | |
Note P – Revenues | |
Note Q – Employee Benefit Plans | |
Note R – Equity-Based Compensation | |
| |
Note S – Net Income (Loss) per Common Share | |
| |
Note T – Related Parties | |
Note U – Segment Reporting | |
Note V – Subsequent Events | |
Report of Independent Registered Public Accounting Firm
To the Shareholders and Board of Directors
Redwire Corporation:
Opinion on the Consolidated Financial Statements
We have audited the accompanying consolidated balance sheets of Redwire Corporation and subsidiaries (the Company) as of December 31, 2025 and 2024, the related consolidated statements of operations and comprehensive income (loss), changes in equity (deficit), and cash flows for each of the years in the three-year period ended December 31, 2025, and the related notes (collectively, the consolidated financial statements). In our opinion, the consolidated financial statements present fairly, in all material respects, the financial position of the Company as of December 31, 2025 and 2024, and the results of its operations and its cash flows for each of the years in the three-year period ended December 31, 2025, in conformity with U.S. generally accepted accounting principles.
We also have audited, in accordance with the standards of the Public Company Accounting Oversight Board (United States) (PCAOB), the Company’s internal control over financial reporting as of December 31, 2025, based on criteria established in Internal Control – Integrated Framework (2013) issued by the Committee of Sponsoring Organizations of the Treadway Commission, and our report dated February 27, 2026 expressed an adverse opinion on the effectiveness of the Company’s internal control over financial reporting.
Basis for Opinion
These consolidated financial statements are the responsibility of the Company’s management. Our responsibility is to express an opinion on these consolidated financial statements based on our audits. We are a public accounting firm registered with the PCAOB and are required to be independent with respect to the Company in accordance with the U.S. federal securities laws and the applicable rules and regulations of the Securities and Exchange Commission and the PCAOB.
We conducted our audits in accordance with the standards of the PCAOB. Those standards require that we plan and perform the audit to obtain reasonable assurance about whether the consolidated financial statements are free of material misstatement, whether due to error or fraud. Our audits included performing procedures to assess the risks of material misstatement of the consolidated financial statements, whether due to error or fraud, and performing procedures that respond to those risks. Such procedures included examining, on a test basis, evidence regarding the amounts and disclosures in the consolidated financial statements. Our audits also included evaluating the accounting principles used and significant estimates made by management, as well as evaluating the overall presentation of the consolidated financial statements. We believe that our audits provide a reasonable basis for our opinion.
Critical Audit Matters
The critical audit matters communicated below are matters arising from the current period audit of the consolidated financial statements that were communicated or required to be communicated to the audit committee and that: (1) relate to accounts or disclosures that are material to the consolidated financial statements and (2) involved our especially challenging, subjective, or complex judgments. The communication of critical audit matters does not alter in any way our opinion on the consolidated financial statements, taken as a whole, and we are not, by communicating the critical audit matters below, providing separate opinions on the critical audit matters or on the accounts or disclosures to which they relate.
Estimates used to recognize revenue for select long-term contracts
As discussed in Notes B and P to the consolidated financial statements, the Company engages in long-term contracts for production and service activities and recognizes revenue for performance obligations over time, using a cost-to-cost measure of progress for firm fixed-price contracts (“FFP”). Under the cost-to-cost method, revenue is recognized based on the proportion of total costs incurred to total estimated costs-at-completion.
For a select group of FFP contracts, we identified the assessment of the estimated amount of costs to complete the contract, that is an input into the amount of revenue recognized during the period, as a critical audit matter. The estimated amount of costs to complete includes estimated costs such as labor hours, the cost of materials for the work to be performed, and sub-contractor services and materials. The evaluation of these assumptions used to recognize revenue for the select group of long-term contracts requires a high level of subjective auditor judgment due to the nature of the individual contracts and related contract performance risks. Specifically, changes to these assumptions may have had a significant impact on the revenue recorded during the period.
The following are the primary procedures we performed to address this critical audit matter. Based on the nature of the individual contract, we evaluated certain cost assumptions by:
•comparison of the Company’s historical estimates of costs to actual costs incurred to assess the Company’s ability to estimate accurately
•reading the underlying contract and any related amendments to obtain an understanding of the contractual requirements and related performance obligations
•assessing costs incurred to date and the relative progress toward satisfying the performance obligation(s) of the contract
•assessing, if relevant, the estimated costs at completion by considering similar or predecessor contracts and programs
•inquiring of financial and operational personnel of the Company to identify factors that should be considered within the estimated costs at completion or indications of potential management bias
•inspecting correspondence, if any, between the Company and the customer regarding actual to date and expected performance
•analyzing the sufficiency of the Company’s assessment of contract performance risks included within the estimated costs at completion.
Fair value of intangible assets acquired in a business combination
As discussed in Note C to the consolidated financial statements, on June 13, 2025, the Company closed its acquisition of Redwire Defense Tech Intermediate Holdings, LLC (formerly known as Edge Autonomy Intermediate Holdings, LLC). Pursuant to the merger agreement, the Company acquired 100% of Redwire Defense Tech Intermediate Holdings, LLC equity for total consideration of $160.0 million in cash and the issuance of 49,764,847 shares of the Company’s common stock. The Company accounted for the acquisition as a business combination by applying the acquisition method of accounting. Accordingly, the purchase price was allocated to the fair value of the assets acquired and liabilities assumed, resulting in the recognition of intangible assets for developed technology of $264.8 million, customer relationships of $15.4 million, trade name and trademark of $17.9 million and goodwill of $721.3 million. The fair value of the acquired developed technology and trade name and trademark was estimated using the relief from royalty method. The fair value of the acquired customer relationships was estimated using the multi-period excess earnings method.
We identified the assessment of the acquisition-date fair value of the developed technology, customer relationships and trade name and trademark intangible assets as a critical audit matter. The evaluation of certain assumptions used to estimate the fair value of these acquired intangible assets involved a higher degree of subjective auditor judgment and specialized skills and knowledge. Specifically, significant assumptions used to estimate the fair value of the acquired developed technology and trade name and trademark included the estimate of the amount and timing of expected future revenue, discount rates and expected royalty rates. The significant assumptions used to estimate fair value of acquired customer relationships included amount and timing of expected future revenue and discount rates. Changes to those significant assumptions could have had an impact on the determination of the fair value of the acquired intangible assets.
The following are the primary procedures we performed to address this critical audit matter. We evaluated the Company’s methodology to develop the fair values of the acquired developed technology, customer relationships and trade name and trademark. We performed sensitivity analyses over the Company’s amount and timing of expected future revenue, discount rates, and expected royalty rates to evaluate the impact of changes in those assumptions on the Company’s determination of fair values. We compared the amount and timing of expected future revenue used within the valuation model to the Company’s underlying business strategies and growth plans. We involved valuation professionals with specialized skills and knowledge, who assisted in:
•evaluating the Company’s amount and timing of expected future revenue by comparing the projected revenues used within the valuation model to applicable industry forecasted long-term revenue growth rates
•evaluating the Company’s discount rates by comparing them to ranges of discount rates that were independently developed using publicly available market data for comparable companies
•evaluating the Company’s expected royalty rates by comparing them to ranges of royalty rates independently developed using market data for comparable license agreements.
/s/ KPMG LLP
We have served as the Company’s auditor since 2023.
Houston, Texas
February 27, 2026
Report of Independent Registered Public Accounting Firm
To the Shareholders and Board of Directors
Redwire Corporation:
Opinion on Internal Control Over Financial Reporting
We have audited Redwire Corporation and subsidiaries' (the Company) internal control over financial reporting as of December 31, 2025, based on criteria established in Internal Control – Integrated Framework (2013) issued by the Committee of Sponsoring Organizations of the Treadway Commission. In our opinion, because of the effect of the material weaknesses, described below, on the achievement of the objectives of the control criteria, the Company has not maintained effective internal control over financial reporting as of December 31, 2025, based on criteria established in Internal Control – Integrated Framework (2013) issued by the Committee of Sponsoring Organizations of the Treadway Commission.
We also have audited, in accordance with the standards of the Public Company Accounting Oversight Board (United States) (PCAOB), the consolidated balance sheets of the Company as of December 31, 2025 and 2024, the related consolidated statements operations and comprehensive income (loss), changes in equity (deficit), and cash flows for each of the years in the three-year period ended December 31, 2025, and the related notes (collectively, the consolidated financial statements), and our report dated February 27, 2026 expressed an unqualified opinion on those consolidated financial statements.
A material weakness is a deficiency, or a combination of deficiencies, in internal control over financial reporting, such that there is a reasonable possibility that a material misstatement of the company’s annual or interim financial statements will not be prevented or detected on a timely basis. The material weaknesses discussed below have been identified and included in management’s assessment.
•For substantially all of the U.S. operations, management designed process-level control activities pervasive across the financial reporting processes, but were unable to fully deploy those process-level control activities with sufficient time to demonstrate their operating effectiveness.
•For the European and remaining U.S. operations:
•Due to insufficient time and resources, management did not i) establish effective information technology (IT) general controls (ITGCs), specifically program change controls and access controls, that support the consistent operation of the Company’s IT operating systems, databases and IT applications, and end user computing over all financial reporting; and, ii) have policies and procedures through which ITGCs are deployed across the organization. Automated process-level controls and manual controls dependent upon the accuracy and completeness of information derived from IT systems were also rendered ineffective because they are affected by the lack of ITGCs.
•As a result, management did not effectively design, implement or operate process-level control activities pervasive across the Company’s financial reporting processes.
The material weaknesses were considered in determining the nature, timing, and extent of audit tests applied in our audit of the 2025 consolidated financial statements, and this report does not affect our report on those consolidated financial statements.
The Company acquired Redwire Defense Tech Intermediate Holdings, LLC (formerly known as Edge Autonomy Intermediate Holdings, LLC) during 2025, and management excluded from its assessment of the effectiveness of the Company’s internal control over financial reporting as of December 31, 2025, Redwire Defense Tech Intermediate Holdings, LLC’s internal control over financial reporting associated with 10% of total assets and 32% of total revenues included in the consolidated financial statements of the Company as of and for the year ended December 31, 2025. Our audit of internal control over financial reporting of the Company also excluded an evaluation of the internal control over financial reporting of Redwire Defense Tech Intermediate Holdings, LLC.
Basis for Opinion
The Company’s management is responsible for maintaining effective internal control over financial reporting and for its assessment of the effectiveness of internal control over financial reporting, included in the accompanying Management’s Report on Internal Control Over Financial Reporting. Our responsibility is to express an opinion on the Company’s internal control over financial reporting based on our audit. We are a public accounting firm registered with the PCAOB and are required to be independent with respect to the Company in accordance with the U.S. federal securities laws and the applicable rules and regulations of the Securities and Exchange Commission and the PCAOB.
We conducted our audit in accordance with the standards of the PCAOB. Those standards require that we plan and perform the audit to obtain reasonable assurance about whether effective internal control over financial reporting was maintained in all material respects. Our audit of internal control over financial reporting included obtaining an understanding of internal control over financial reporting, assessing the risk that a material weakness exists, and testing and evaluating the design and operating effectiveness of internal control based on the assessed risk. Our audit also included performing such other procedures as we considered necessary in the circumstances. We believe that our audit provides a reasonable basis for our opinion.
Definition and Limitations of Internal Control Over Financial Reporting
A company’s internal control over financial reporting is a process designed to provide reasonable assurance regarding the reliability of financial reporting and the preparation of financial statements for external purposes in accordance with generally accepted accounting principles. A company’s internal control over financial reporting includes those policies and procedures that (1) pertain to the maintenance of records that, in reasonable detail, accurately and fairly reflect the transactions and dispositions of the assets of the company; (2) provide reasonable assurance that transactions are recorded as necessary to permit preparation of financial statements in accordance with generally accepted accounting principles, and that receipts and expenditures of the company are being made only in accordance with authorizations of management and directors of the company; and (3) provide reasonable assurance regarding prevention or timely detection of unauthorized acquisition, use, or disposition of the company’s assets that could have a material effect on the financial statements.
Because of its inherent limitations, internal control over financial reporting may not prevent or detect misstatements. Also, projections of any evaluation of effectiveness to future periods are subject to the risk that controls may become inadequate because of changes in conditions, or that the degree of compliance with the policies or procedures may deteriorate.
/s/ KPMG LLP
Houston, Texas
February 27, 2026
REDWIRE CORPORATION
CONSOLIDATED BALANCE SHEETS
(In thousands of U.S. dollars, except share data)
| | | | | | | | | | | | | |
| | December 31, 2025 | | December 31, 2024 | | |
Assets | | | | | |
Current assets: | | | | | |
Cash, cash equivalents and restricted cash | $ | 95,183 | | | $ | 49,071 | | | |
Accounts receivable, net | 37,251 | | | 21,905 | | | |
Contract assets | 44,019 | | | 43,044 | | | |
Inventory, net | 55,847 | | | 2,239 | | | |
| | | | | |
| | | | | |
| | | | | |
Prepaid expenses and other current assets | 20,512 | | | 9,666 | | | |
Total current assets | 252,812 | | | 125,925 | | | |
Property, plant and equipment, net | 49,199 | | | 17,837 | | | |
| Right-of-use assets | 31,741 | | | 15,277 | | | |
Intangible assets, net | 336,153 | | | 61,788 | | | |
Goodwill | 779,114 | | | 71,161 | | | |
| | | | | |
| | | | | |
Other non-current assets | 118 | | | 629 | | | |
Total assets | $ | 1,449,137 | | | $ | 292,617 | | | |
| | | | | |
Liabilities, Convertible Preferred Stock and Equity (Deficit) | | | | | |
Current liabilities: | | | | | |
Accounts payable | $ | 32,295 | | | $ | 32,127 | | | |
Notes payable to sellers | 2,171 | | | — | | | |
Short-term debt, including current portion of long-term debt | 5,162 | | | 1,266 | | | |
| Short-term operating lease liabilities | 4,088 | | | 4,354 | | | |
| Short-term finance lease liabilities | 595 | | | 473 | | | |
Accrued expenses | 32,034 | | | 24,192 | | | |
Deferred revenue | 60,119 | | | 67,201 | | | |
Other current liabilities | 19,150 | | | 19,730 | | | |
Total current liabilities | 155,614 | | | 149,343 | | | |
Long-term debt, net | 80,036 | | | 124,464 | | | |
| Long-term operating lease liabilities | 30,471 | | | 13,444 | | | |
| Long-term finance lease liabilities | 1,276 | | | 980 | | | |
| Warrant liabilities | 4,213 | | | 55,285 | | | |
Deferred tax liabilities | 38,358 | | | 582 | | | |
Other non-current liabilities | 2,119 | | | 428 | | | |
Total liabilities | $ | 312,087 | | | $ | 344,526 | | | |
Commitments and contingencies (Note M – Commitments and Contingencies) | | | | | |
| | | | | |
| | |
| | | | | |
| | | | | |
| | | | | |
| | | | | |
Convertible preferred stock, $0.0001 par value, 125,292.00 shares authorized; issued and outstanding: 2025—46,505.13 and 2024—108,649.30. Liquidation preference: 2025—$118,434 and 2024—$599,412 (Note N – Convertible Preferred Stock) | $ | 77,034 | | | $ | 136,805 | | | |
| | | | | |
Shareholders’ Equity (Deficit): | | | | | |
Preferred stock, $0.0001 par value, 99,874,708 shares authorized; none issued and outstanding | — | | | — | | | |
Common stock, $0.0001 par value, 500,000,000 shares authorized; issued and outstanding 2025—191,915,804 and 2024—67,002,370 | 19 | | | 7 | | | |
Treasury stock, at cost: 2025—1,036,294 shares and 2024—728,739 shares | (7,342) | | | (3,573) | | | |
Additional paid-in capital | 1,678,799 | | | 161,619 | | | |
Accumulated deficit | (621,762) | | | (348,106) | | | |
Accumulated other comprehensive income (loss) | 10,302 | | | 1,339 | | | |
| Total shareholders’ equity (deficit) | 1,060,016 | | | (188,714) | | | |
| | | | | |
| | | | | |
Total liabilities, convertible preferred stock and equity (deficit) | $ | 1,449,137 | | | $ | 292,617 | | | |
The accompanying notes are an integral part of these consolidated financial statements.
REDWIRE CORPORATION
CONSOLIDATED STATEMENTS OF OPERATIONS AND COMPREHENSIVE INCOME (LOSS)
(In thousands of U.S. dollars, except share and per share data)
| | | | | | | | | | | | | | | | | | | | | | | | |
| | | | | | | | | | |
| | | Year Ended | | | |
| | | | | | December 31, 2025 | | December 31, 2024 | | December 31, 2023 | | | |
Revenues | | | | | $ | 335,381 | | | $ | 304,101 | | | 243,800 | | | | |
Cost of sales | | | | | 318,096 | | | 259,646 | | | 185,831 | | | | |
Gross profit | | | | | 17,285 | | | 44,455 | | | 57,969 | | | | |
Operating expenses: | | | | | | | | | | | | |
Selling, general and administrative expenses | | | | | 171,280 | | | 71,398 | | | 68,525 | | | | |
| | | | | | | | | | | | |
Transaction expenses | | | | | 21,236 | | | 9,129 | | | 13 | | | | |
| | | | | | | | | | | | |
Impairment expense | | | | | 34,685 | | | — | | | — | | | | |
Research and development | | | | | 19,761 | | | 6,128 | | | 4,979 | | | | |
Operating income (loss) | | | | | (229,677) | | | (42,200) | | | (15,548) | | | | |
Interest expense, net | | | | | 39,704 | | | 13,483 | | | 10,699 | | | | |
| Loss on extinguishment of debt | | | | | 996 | | | — | | | — | | | | |
Other (income) expense, net | | | | | (18,811) | | | 60,648 | | | 1,503 | | | | |
Income (loss) before income taxes | | | | | (251,566) | | | (116,331) | | | (27,750) | | | | |
Income tax expense (benefit) | | | | | (25,014) | | | (2,020) | | | (486) | | | | |
Net income (loss) | | | | | (226,552) | | | (114,311) | | | (27,264) | | | | |
| Net income (loss) attributable to noncontrolling interests | | | | | — | | | 4 | | | (1) | | | | |
| Net income (loss) attributable to Redwire Corporation | | | | | (226,552) | | | (114,315) | | | (27,263) | | | | |
| Less: dividends on Convertible Preferred Stock | | | | | 45,777 | | | 41,052 | | | 20,021 | | | | |
| Net income (loss) available to common shareholders | | | | | $ | (272,329) | | | $ | (155,367) | | | $ | (47,284) | | | | |
| | | | | | | | | | | | |
| Net income (loss) per common share: | | | | | | | | | | | | |
Basic and diluted | | | | | $ | (2.28) | | | $ | (2.35) | | | $ | (0.73) | | | | |
| | | | | | | | | | | | |
Weighted-average shares outstanding: | | | | | | | | | | | | |
Basic and diluted | | | | | 119,544,268 | | | 66,146,155 | | | 64,654,153 | | | | |
| | | | | | | | | | | | |
| | | | | | | | | | | | |
Comprehensive income (loss): | | | | | | | | | | | | |
| Net income (loss) attributable to Redwire Corporation | | | | | $ | (226,552) | | | $ | (114,315) | | | (27,263) | | | | |
Foreign currency translation gain (loss), net of tax | | | | | 8,963 | | | (1,407) | | | 830 | | | | |
Total other comprehensive income (loss), net of tax | | | | | 8,963 | | | (1,407) | | | 830 | | | | |
Total comprehensive income (loss) | | | | | $ | (217,589) | | | $ | (115,722) | | | $ | (26,433) | | | | |
| | | | | | | | | | | | |
The accompanying notes are an integral part of these consolidated financial statements.
REDWIRE CORPORATION
CONSOLIDATED STATEMENTS OF CHANGES IN EQUITY (DEFICIT)
(In thousands of U.S. dollars, except share data)
| | | | | | | | | | | | | | | | | | | | | | | | | | | | | | | | | | | | | | | | | | | | | | | | | | | | | | | | | | | |
| Common Stock | | Treasury Stock | | Additional
Paid-in
Capital | | Accumulated
Deficit | | Accumulated
Other
Comprehensive
Income (Loss) | | Total Shareholders’ Equity (Deficit) | | Noncontrolling Interests | | Total Equity (Deficit) |
| Shares | | Amount | | Shares | | Amount | | | | | | |
| Balance as of December 31, 2022 | 64,280,631 | | | $ | 6 | | | 141,811 | | | $ | (381) | | | $ | 198,126 | | | $ | (206,528) | | | $ | 2,076 | | | $ | (6,701) | | | $ | 226 | | | $ | (6,475) | |
| | | | | | | | | | | | | | | | | | | |
| | | | | | | | | | | | | | | | | | | |
| | | | | | | | | | | | | | | | | | | |
Equity-based compensation expense | — | | | — | | | — | | | — | | | 8,658 | | | — | | | — | | | 8,658 | | | — | | | 8,658 | |
| Common stock issued under the committed equity facility | 497,392 | | | — | | | — | | | — | | | 1,280 | | | — | | | — | | | 1,280 | | | — | | | 1,280 | |
| | | | | | | | | | | | | | | | | | | |
| Common stock issued for share-based awards | 768,151 | | | 1 | | | — | | | — | | | — | | | — | | | — | | | 1 | | | — | | | 1 | |
| Shares repurchased for settlement of employee tax withholdings on share-based awards | — | | | — | | | 211,659 | | | (570) | | | | | — | | | — | | | (570) | | | — | | | (570) | |
| Convertible preferred stock paid-in-kind dividend | — | | | — | | | — | | | — | | | (19,741) | | | — | | | — | | | (19,741) | | | — | | | (19,741) | |
| | | | | | | | | | | | | | | | | | | |
Foreign currency translation, net of tax | — | | | — | | | — | | | — | | | — | | | — | | | 827 | | | 827 | | | 3 | | | 830 | |
Net income (loss) | — | | | — | | | — | | | — | | | — | | | (27,263) | | | — | | | (27,263) | | | (1) | | | (27,264) | |
| | | | | | | | | | | | | | | | | | | |
| Balance as of December 31, 2023 | 65,546,174 | | | $ | 7 | | | 353,470 | | | $ | (951) | | | $ | 188,323 | | | $ | (233,791) | | | $ | 2,903 | | | $ | (43,509) | | | $ | 228 | | | $ | (43,281) | |
| Equity-based compensation expense | — | | | — | | | — | | | — | | | 11,326 | | | — | | | — | | | 11,326 | | | — | | | 11,326 | |
| | | | | | | | | | | | | | | | | | | |
| Common stock issued for share-based awards | 1,456,196 | | | — | | | — | | | — | | | 2,669 | | | — | | | — | | | 2,669 | | | — | | | 2,669 | |
| Shares repurchased for settlement of employee tax withholdings on share-based awards | — | | | — | | | 375,269 | | | (2,622) | | | — | | | — | | | — | | | (2,622) | | | — | | | (2,622) | |
| Convertible preferred stock paid-in-kind dividend | — | | | — | | | — | | | — | | | (40,699) | | | — | | | — | | | (40,699) | | | — | | | (40,699) | |
| Sale of joint ventures | — | | | — | | | | | | | — | | | — | | | (164) | | | (164) | | | (225) | | | (389) | |
| Foreign currency translation, net of tax | — | | | — | | | — | | | — | | | — | | | — | | | (1,400) | | | (1,400) | | | (7) | | | (1,407) | |
Net income (loss) | — | | | — | | | — | | | — | | | — | | | (114,315) | | | — | | | (114,315) | | | 4 | | | (114,311) | |
| Balance as of December 31, 2024 | 67,002,370 | | | $ | 7 | | | 728,739 | | | $ | (3,573) | | | $ | 161,619 | | | $ | (348,106) | | | $ | 1,339 | | | $ | (188,714) | | | $ | — | | | $ | (188,714) | |
| Equity-based compensation expense | — | | | — | | | — | | | — | | | 58,990 | | | — | | | — | | | 58,990 | | | — | | | 58,990 | |
| Common stock issued in offering | 16,125,100 | | | 1 | | | — | | | — | | | 254,157 | | | — | | | — | | | 254,158 | | | — | | | 254,158 | |
| Common stock issued in connection with Edge Acquisition | 49,764,847 | | | 5 | | | — | | | — | | | 862,556 | | | — | | | — | | | 862,561 | | | — | | | 862,561 | |
| | | | | | | | | | | | | | | | | | | |
| Common stock issued for share-based awards | 2,474,793 | | | — | | | — | | | — | | | 1,400 | | | — | | | — | | | 1,400 | | | — | | | 1,400 | |
| Common stock issued for warrants exercised | 9,499,138 | | | 1 | | | — | | | — | | | 117,779 | | | — | | | — | | | 117,780 | | | — | | | 117,780 | |
| Common stock issued under the ATM facility | 25,520,441 | | | 3 | | | — | | | — | | | 179,287 | | | — | | | — | | | 179,290 | | | — | | | 179,290 | |
| Shares repurchased for settlement of employee tax withholdings on share-based awards | — | | | — | | | 307,555 | | | (3,769) | | | — | | | — | | | — | | | (3,769) | | | — | | | (3,769) | |
| Convertible preferred stock paid-in-kind dividend | — | | | — | | | — | | | — | | | (47,146) | | | — | | | — | | | (47,146) | | | — | | | (47,146) | |
| Convertible preferred stock converted to common stock | 21,529,115 | | | 2 | | | — | | | — | | | 90,157 | | | — | | | — | | | 90,159 | | | — | | | 90,159 | |
| | | | | | | | | | | | | | | | | | | |
| Convertible preferred stock repurchased | — | | | — | | | — | | | — | | | — | | | (47,104) | | | — | | | (47,104) | | | — | | | (47,104) | |
| Foreign currency translation, net of tax | — | | | — | | | — | | | — | | | — | | | — | | | 8,963 | | | 8,963 | | | — | | | 8,963 | |
| Net loss | — | | | — | | | — | | | — | | | — | | | (226,552) | | | — | | | (226,552) | | | — | | | (226,552) | |
| | | | | | | | | | | | | | | | | | | |
| Balance as of December 31, 2025 | 191,915,804 | | | $ | 19 | | | 1,036,294 | | | $ | (7,342) | | | $ | 1,678,799 | | | $ | (621,762) | | | $ | 10,302 | | | $ | 1,060,016 | | | $ | — | | | $ | 1,060,016 | |
The accompanying notes are an integral part of these consolidated financial statements.
REDWIRE CORPORATION
CONSOLIDATED STATEMENTS OF CASH FLOWS
(In thousands of U.S. dollars)
| | | | | | | | | | | | | | | | | | |
| Year Ended | |
| December 31, 2025 | | December 31, 2024 | | December 31, 2023 | |
Cash flows from operating activities: | | | | | | |
| | | | | | |
| | | | | | |
| Net income (loss) | $ | (226,552) | | | $ | (114,311) | | | $ | (27,264) | | |
Adjustments to reconcile net income (loss) to net cash provided by (used in) operating activities: | | | | | | |
Depreciation and amortization expense | 32,639 | | | 11,692 | | | 10,724 | | |
Amortization of debt issuance costs and discount | 2,282 | | | 857 | | | 608 | | |
| | | | | | |
Equity-based compensation expense | 58,990 | | | 11,326 | | | 8,658 | | |
| | | | | | |
| | | | | | |
| | | | | | |
| | | | | | |
| | | | | | |
| (Gain) loss on sale of joint ventures | — | | | (1,303) | | | — | | |
| Loss on extinguishment of debt | 996 | | | — | | | — | | |
| (Gain) loss on change in fair value of committed equity facility | — | | | — | | | 255 | |
| (Gain) loss on change in fair value of warrants | (16,109) | | | 51,960 | | | 2,011 | | |
Deferred provision (benefit) for income taxes | (24,901) | | | (1,803) | | | (925) | | |
| Impairment expense | 34,685 | | | — | | | — | | |
| | | | | | |
| Income from equity method investments | — | | | — | | | (245) | | |
Non-cash lease expense | 488 | | | 227 | | | 327 | | |
| Non-cash interest expense | — | | | — | | | 525 | |
| Purchase accounting fair value adjustment related to inventory | 13,645 | | | — | | | — | | |
| Other | (1,470) | | | 2,050 | | | (238) | | |
Changes in assets and liabilities: | | | | | | |
(Increase) decrease in accounts receivable | (2,321) | | | 14,670 | | | (5,562) | | |
(Increase) decrease in contract assets | 863 | | | (7,138) | | | (5,442) | | |
(Increase) decrease in inventory | (6,652) | | | (734) | | | (44) | | |
| | | | | | |
(Increase) decrease in prepaid expenses and other assets | (4,386) | | | (1,793) | | | 229 | | |
| | | | | | |
Increase (decrease) in accounts payable and accrued expenses | (11,660) | | | 4,365 | | | (3,280) | | |
Increase (decrease) in deferred revenue | (33,980) | | | 3,207 | | | 22,736 | | |
Increase (decrease) in operating lease liabilities | (232) | | | (342) | | | (325) | | |
Increase (decrease) in other liabilities | 6,344 | | | 9,722 | | | (960) | | |
Increase (decrease) in notes payable to sellers | — | | | — | | | (557) | | |
Net cash provided by (used in) operating activities | (177,331) | | | (17,348) | | | 1,231 | | |
| | | | | | |
Cash flows from investing activities: | | | | | | |
Acquisition of businesses, net of cash acquired | (151,791) | | | (881) | | | — | | |
| Net proceeds from sale of joint ventures | — | | | 4,598 | | | — | | |
Purchases of property, plant and equipment | (13,479) | | | (6,399) | | | (5,620) | | |
| Purchase of intangible assets | (9,801) | | | (4,517) | | | (2,707) | | |
| | | | | | |
| | | | | | |
Net cash provided by (used in) investing activities | (175,071) | | | (7,199) | | | (8,327) | | |
| | | | | | |
Cash flows from financing activities: | | | | | | |
Proceeds received from debt | 191,131 | | | 45,971 | | | 36,696 | | |
Repayments of debt | (234,165) | | | (8,863) | | | (26,683) | | |
Payment of debt issuance fees | (105) | | | (780) | | | (163) | | |
| Repayment of finance leases | (534) | | | (479) | | | (395) | | |
Proceeds from (repayment of) third-party advances | (7,820) | | | 7,820 | | | — | | |
| Proceeds from issuance of common stock | 518,370 | | | 2,669 | | | 1,241 | | |
| Payment of equity issuance costs | (1,749) | | | — | | | (571) | | |
| | | | | | |
| Payments of issuance costs related to convertible preferred stock | — | | | — | | | (52) | | |
Shares repurchased for settlement of employee tax withholdings on share-based awards | (3,769) | | | (2,622) | | | (570) | | |
| | | | | | |
| | | | | | |
| Payment of contingent earnout | — | | | — | | | (443) | | |
| | | | | | |
| Repurchase of convertible preferred stock | (63,863) | | | — | | | — | | |
Net cash provided by (used in) financing activities | 397,496 | | | 43,716 | | | 9,060 | | |
Effect of foreign currency rate changes on cash, cash equivalents and restricted cash | 1,018 | | | (376) | | | (2) | | |
Net increase (decrease) in cash, cash equivalents and restricted cash | 46,112 | | | 18,793 | | | 1,962 | | |
Cash, cash equivalents and restricted cash at beginning of period | 49,071 | | | 30,278 | | | 28,316 | | |
Cash, cash equivalents and restricted cash at end of period | $ | 95,183 | | | $ | 49,071 | | | $ | 30,278 | | |
| | | | | | |
| | | | | | |
| | | | | | |
| | | | | | |
| | | | | | |
| | | | | | |
| | | | | | |
| | | | | | |
| | | | | | |
| | | | | | |
| | | | | | |
| | | | | | |
| | | | | | |
| | | | | | |
The accompanying notes are an integral part of these consolidated financial statements.
REDWIRE CORPORATION
NOTES TO CONSOLIDATED FINANCIAL STATEMENTS
(Tabular amounts in thousands of U.S. dollars, except percentages, unit, share, and warrant amounts)
Note A – Description of the Business
Redwire Corporation (the “Company” or “Redwire”) is an integrated space and defense technology company focused on advanced technologies including aerospace infrastructure, autonomous systems and multi-domain operations, leveraging digital engineering and artificial intelligence automation. The Company develops and provides mission critical solutions based on space and defense technology platform offerings for government, commercial and civil customers through both short- and long-duration projects. These include technologies and production capability for next-generation spacecraft, large space infrastructure, microgravity capabilities, combat-proven autonomous systems, optical sensors and radio frequency payloads that provide intelligence, surveillance, and reconnaissance capabilities for U.S. and allied nations across multiple domains. The Company serves both U.S. and international customers. As described in Note U – Segment Reporting, we operate in two business segments: Space and Defense Tech.
Note B – Summary of Significant Accounting Policies
Basis of Presentation
The accompanying consolidated financial statements have been prepared in accordance with United States Generally Accepted Accounting Principles (“U.S. GAAP”) and include the accounts of subsidiaries we control and variable interest entities if we are the primary beneficiary. All intercompany balances and transactions have been eliminated in consolidation. Certain prior year amounts have been reclassified to conform with the current year presentation. These reclassifications had no effect on the reported results of operations.
Use of Estimates
The preparation of financial statements in conformity with U.S. GAAP requires management to make estimates and assumptions that affect the reported amounts of assets and liabilities as of the date of the financial statements and the reported amounts of revenues and expenses during the reporting periods.
Management has prepared these estimates using the most current and best available information that is considered reasonable under the circumstances. However, actual results could differ materially from those estimates. Significant accounting policies subject to estimates include, but are not limited to, valuation of goodwill and intangible assets, revenue recognition, income taxes, certain equity-based compensation awards, post-retirement benefit plans, paid-in-kind dividends, and warrant liabilities.
Business Combinations
The Company utilizes the acquisition method of accounting for all transactions and events in which it obtains control over one or more other businesses (even if less than 100% ownership is acquired), to recognize the fair value of all assets acquired and liabilities assumed and to establish the acquisition date fair value as of the measurement date.
While the Company uses its best estimates and assumptions as part of the purchase price allocation process to accurately value assets acquired and liabilities assumed at the business combination date, the estimates and assumptions are inherently uncertain and subject to refinement. As a result, during the measurement period, which may be up to one year from the business combination date, the Company records adjustments to the assets acquired and liabilities assumed, with the corresponding offset to goodwill. For changes in the valuation of intangible assets between the preliminary and final purchase price allocation, the related amortization is adjusted in the period it occurs. Subsequent to the measurement period, any adjustment to assets acquired or liabilities assumed is included in operating results in the period in which the adjustment is identified. Transaction costs that are incurred in connection with a business combination, other than costs associated with the issuance of debt or equity securities, are expensed as incurred.
Contingent consideration is classified as a liability or as equity on the basis of the definitions of a financial liability and an equity instrument; contingent consideration payable in cash is classified as a liability. The Company recognizes the fair value of any contingent consideration that is transferred to the seller in a business combination on the date at which control of the acquiree is obtained. Contingent consideration payments related to acquisitions are measured at fair value each reporting period using Level 3 unobservable inputs (as defined in the Fair Value of Financial Instruments policy below). When reported, any changes in the fair value of these contingent consideration payments are included in contingent earnout expense on the consolidated statements of operations and comprehensive income (loss).
Please refer to Note C – Business Combinations for additional information related to the Company’s business combinations.
Fair Value of Financial Instruments
The Company measures certain financial assets and liabilities, including, but not limited to, contingent consideration, at fair value. A
REDWIRE CORPORATION
NOTES TO CONSOLIDATED FINANCIAL STATEMENTS
(Tabular amounts in thousands of U.S. dollars, except percentages, unit, share, and warrant amounts)
hierarchy of valuation techniques is based on whether the inputs to those valuation techniques are observable or unobservable. Observable inputs reflect market data obtained from independent sources, while unobservable inputs reflect the Company’s market assumptions. These two types of inputs have created the following fair-value hierarchy:
| | | | | |
Level 1: | Quoted prices for identical instruments in active markets; |
Level 2: | Quoted prices for similar instruments in active markets, quoted prices for identical or similar instruments in markets that are not active, and model-derived valuations in which all significant inputs and significant value drivers are observable in active markets; and |
Level 3: | Valuations derived from valuation techniques in which one or more significant inputs or significant value drivers are unobservable. |
Foreign Currency Translation
The Company’s consolidated financial statements are presented in United States dollars (“USD”), which is the functional currency of the Company. The local currency of the Company’s foreign operations is considered to be the functional currency of those operations, which is primarily the Euro. Assets and liabilities of the Company’s foreign subsidiaries, where the functional currency is the local currency, are translated into USD at exchange rates effective as of the balance sheet date. Revenues and expenses are translated using average exchange rates in effect for the periods presented.
Foreign currency translation adjustments are reported in accumulated other comprehensive income (loss). Realized gains and losses on foreign currency transactions are included in other (income) expense, net on the consolidated statements of operations and comprehensive income (loss).
Cash, Cash Equivalents and Restricted Cash
Cash and cash equivalents includes cash on hand, cash balances with banks and similar institutions and all highly liquid investments with an original maturity of three months or less. Restricted cash includes cash balances which are restricted as to withdrawal or usage by contractual agreement and consists of cash-collateralized standby letters of credit for performance guarantees and submitted proposals.
The Company had $0.7 million and $15.4 million of restricted cash as of December 31, 2025 and 2024, respectively, related to standby letters of credit for performance guarantees and submitted proposals which are legally restricted for withdrawal and use. Amounts may be subject to final price adjustments upon delivery and acceptance of the related performance obligations by the customer. As of December 31, 2024, restricted cash included $7.8 million of proceeds received from third-parties that were refundable except in certain limited circumstances and were also reported as other current liabilities on the consolidated balance sheets. During the year ended December 31, 2025, the $7.8 million of restricted cash was refunded and the associated liability was relieved.
The following table provides a reconciliation of cash, cash equivalents and restricted cash reported on the consolidated balance sheets to the consolidated statements of cash flows as of the following periods:
| | | | | | | | | | | | | | | | | |
| December 31, 2025 | | December 31, 2024 | | December 31, 2023 |
Cash and cash equivalents | $ | 94,467 | | | $ | 33,712 | | | $ | 30,278 | |
Restricted cash | 716 | | | 15,359 | | | — | |
Total cash, cash equivalents and restricted cash | $ | 95,183 | | | $ | 49,071 | | | $ | 30,278 | |
| | | | | |
REDWIRE CORPORATION
NOTES TO CONSOLIDATED FINANCIAL STATEMENTS
(Tabular amounts in thousands of U.S. dollars, except percentages, unit, share, and warrant amounts)
The table below presents supplemental cash flow information during the following periods:
| | | | | | | | | | | | | | | | | |
| Year Ended |
| December 31, 2025 | | December 31, 2024 | | December 31, 2023 |
| Supplemental cash flow information: | | | | | |
Cash paid (received) during the period for: | | | | | |
Interest | $ | 39,125 | | | $ | 12,159 | | | $ | 9,082 | |
| | | | | |
| | | | | |
| | | | | |
Non-Cash Investing and Financing Activities: | | | | | |
| Convertible Preferred Stock dividend paid-in-kind | $ | 47,146 | | | $ | 40,699 | | | $ | 19,741 | |
Equity consideration in acquisition of businesses | 862,561 | | | — | | | — | |
Settlement of private warrant liabilities for common stock | 34,963 | | | — | | | — | |
Exchange of Series A Convertible Preferred Stock for common stock | 90,159 | | | — | | | — | |
| | | | | |
Capital expenditures not yet paid | 3,151 | | | 2,069 | | | 1,321 | |
| | | | | |
Income taxes paid for the years ended December 31, 2025 and 2023 was nominal and for the year ended December 31, 2024 was $0.2 million.
Concentration of Credit Risk
Financial instruments which potentially subject the Company to concentrations of credit risk consist primarily of cash and cash equivalents, certificates of deposit, accounts receivable and contract assets. The Company places its cash and cash equivalents with financial institutions of high-credit quality. At times, such amounts may exceed federally insured limits. Cash and cash equivalents on deposit or invested with financial and lending institutions was $94.5 million and $33.7 million, as of December 31, 2025 and 2024, respectively.
The Company provides credit to customers in the normal course of business. The carrying amount of current accounts receivable and contract assets are stated at cost, net of an allowance for credit losses. The Company performs ongoing credit evaluations of its customers’ financial condition and limits the amount of credit extended when deemed necessary. The Company maintains an allowance for credit losses to provide for the estimated amount of accounts receivable that will not be fully collected. The allowance is based on the assessment of the following factors: customer creditworthiness, historical payment experience, age of outstanding accounts receivable and any applicable collateral. Substantially all accounts receivable as of December 31, 2025 are expected to be collected in 2026. The Company does not believe there is a significant exposure to credit risk as the majority of the Company’s accounts receivable are due from U.S. and foreign governments or large prime contractors of such government entities. As a result, the allowance for credit losses was not material as of December 31, 2025 and 2024, respectively.
Inventory
Inventory is stated at the lower of cost or net realizable value. Cost is calculated on a first-in, first-out (“FIFO”) basis. Inventory may consist of raw materials, work-in-process, and finished goods. Net realizable value is the estimated selling price in the ordinary course of business, less the estimated costs of completion and selling expense. Inventory is impaired when it is probable that inventory values exceed their net realizable value. Changes in these estimates are included in cost of sales in the consolidated statements of operations and comprehensive income (loss).
Property, Plant and Equipment
Property, plant and equipment are the long-lived, physical assets of the Company, acquired for use in the Company’s normal business operations and not intended for resale by the Company. These assets are recorded at cost. Renewals and betterments that increase the useful lives of the assets are capitalized. The Company occasionally designs and builds its own machinery. The cost of these projects, including direct material and labor, and other indirect costs directly attributable to the construction, are capitalized as construction in progress. No provision for depreciation is made on construction in progress until the related assets are completed and placed in service.
Depreciation is based on the estimated useful lives of the assets using the straight-line method and is included in selling, general and administrative expenses or cost of sales based upon the asset; depreciation and amortization expense includes the amortization of assets under finance leases.
REDWIRE CORPORATION
NOTES TO CONSOLIDATED FINANCIAL STATEMENTS
(Tabular amounts in thousands of U.S. dollars, except percentages, unit, share, and warrant amounts)
Expected useful lives for property, plant and equipment are reviewed at least annually. Estimated useful lives are as follows:
| | | | | |
| Estimated useful life in years |
Computer equipment | 3 |
Furniture and fixtures | 7 |
Laboratory equipment | 3-15 |
Vehicles | 5-7 |
Leasehold improvements | shorter of 5 or lease term |
| Assets subject to finance lease | lease term |
As assets are retired or sold, the related cost and accumulated depreciation are removed from the accounts and any resulting gain or loss is included in other (income) expense, net in the consolidated statements of operations and comprehensive income (loss).
The Company regularly evaluates its property, plant and equipment for impairment when events or changes in circumstances indicate that the carrying amount of an asset or asset group may not be recoverable. If the Company determines that the carrying amount of an asset or asset group is not recoverable based upon the undiscounted expected future cash flows of the asset or asset group, the Company records an impairment loss equal to the excess of carrying amount over the estimated fair value of the asset or asset group.
During 2025, the Company identified triggering events and performed impairment assessments on its long-lived asset groups. Please refer to Note F – Property, Plant and Equipment, net for additional information. During 2024 and 2023, the Company identified no triggering events and therefore, no quantitative impairment assessment was performed on its long-lived assets.
Leases
The Company is obligated under certain operating and finance leases for its facilities, vehicles and office equipment. The Company assesses whether an arrangement is a lease or contains a lease at inception of the arrangement. For arrangements considered leases, the Company assesses the lease for finance or operating classification and records a right-of-use (“ROU”) asset and lease liability as of the commencement date. The Company uses the date of initial possession as the lease commencement date, which is generally when the underlying asset becomes available for the Company’s specific use. The Company’s operating leases are included in right-of-use assets, short-term operating lease liabilities and long-term operating lease liabilities on the consolidated balance sheets. The Company’s finance leases consist primarily of vehicles and are included in property, plant and equipment, net, short-term finance lease liabilities and long-term finance lease liabilities on the consolidated balance sheets.
ROU assets represent the Company’s right to use the underlying asset for the lease term and are amortized over the shorter of the useful life of the asset and the lease term. Lease liabilities represent the present value of the Company’s obligations to make payments arising over the lease term. The present value of the lease payments is calculated using the incremental borrowing rate as of the lease commencement date, which reflects the fixed rate the Company would have to pay to borrow an amount equal to the future minimum lease payments over a similar term. Operating lease expense includes the sum of imputed interest expense and the amortization of ROU assets. For finance leases, interest is recognized and presented separately in interest expense, net on the consolidated statements of operations and comprehensive income (loss). The lease term includes renewal options which are reasonably certain to be exercised.
Lease and non-lease related components, such as common area maintenance costs, obligations to return the underlying asset to its original condition, or costs to dismantle and remove the underlying asset at the end of the term, are accounted for separately. Certain leasing arrangements contain predetermined fixed escalation of minimum rents and/or require variable payments, such as insurance and tax payments. Variable lease payments which depend on an index or other rate are initially measured using the index or rate at the commencement date and included in the measurement of the ROU asset and lease liability. The subsequent change in lease payments as a result of a change in the index or other rate are recognized as expense in the period in which the payment occurs.
The Company does not have any material restrictions or covenants in its lease agreements, sale leaseback transactions or residual value guarantees. Leases with an initial term of twelve months or less are not recorded on the Company’s consolidated balance sheets and are recognized as lease expense on a straight-line basis in the consolidated statements of operations and comprehensive income (loss).
During 2025, the Company abandoned a leased property and recorded a nominal amount of impairment expense related to the respective ROU asset. During 2024 and 2023, the Company identified no triggering events and therefore, no quantitative impairment assessment was performed on its right-of-use assets.
REDWIRE CORPORATION
NOTES TO CONSOLIDATED FINANCIAL STATEMENTS
(Tabular amounts in thousands of U.S. dollars, except percentages, unit, share, and warrant amounts)
Intangible Assets, including Goodwill
The assets and liabilities of acquired businesses are recorded under the acquisition method of accounting at their estimated fair values at the date of acquisition.
Intangible assets include those acquired from the Company’s various business combinations as well as licensed software for internal-use. Licensed software is acquired solely to meet the Company’s internal needs which provides the right to take possession of the software and is hosted on the Company’s specific hardware components, as well as the capitalization of qualifying costs during the application development stage. Indefinite-lived intangible assets include tradenames and in-process research and development (“IPR&D”). Finite-lived intangible assets include customer relationships, technology, trademarks, and internal-use software. Finite-lived intangible assets are reported at cost, net of accumulated amortization, and are either amortized on a straight-line basis over their estimated useful lives or over the period the economic benefits of the intangible assets are consumed. IPR&D is recognized as an indefinite-lived intangible asset until completion or abandonment of the related project, then reclassified as a finite-lived intangible asset and amortized over the remaining useful life.
Acquired intangible assets deemed to have indefinite lives are not amortized, but are subject to annual impairment testing or more frequently if events or a change in circumstance indicate that it is more likely than not that the asset is impaired. This testing compares carrying value to fair value and, when appropriate, the carrying value of these assets is reduced to fair value. The Company performs an impairment test of finite-lived intangibles whenever events or changes in circumstances indicate their carrying value may be impaired, consistent with the methodologies previously disclosed for Property, plant and equipment.
Goodwill is the amount by which the purchase price exceeded the fair value of the net identifiable assets acquired and liabilities assumed in a business combination on the date of acquisition. The Company’s goodwill has been allocated to and is tested for impairment at a level referred to as the reporting unit. As of its annual assessment date, the Company had six reporting units, Mission Solutions, Space Components, Engineering Services, Space Europe, Airborne U.S and Airborne Europe, which were determined based on similar economic characteristics, financial metrics and product and servicing offerings. Effective December 2025, in connection with the change in operating segments, the Company reassessed its reporting units and identified six reporting units, Space Mission Solutions, Space US, Space Europe, Space Defense Tech, North America Defense Tech, and Europe Defense Tech. As a result, the Company allocated the goodwill balance to each reporting unit and respective reportable operating segments during December 2025. Space Mission Solutions, Space U.S. and Space Europe are within the Space segment and Space Defense Tech, North America Defense Tech, and Europe Defense Tech are within the Defense Tech segment.
The Company tests goodwill for impairment annually as of October 1st or when events and circumstances indicate that it is more likely than not that the fair value of a reporting unit is less than its carrying value. The Company first assesses goodwill for impairment on a qualitative basis to determine if a quantitative assessment is necessary. In circumstances where the qualitative analysis (Step 0) indicates that it is more likely than not that the fair value of a reporting unit does not exceed its carrying value, the Company would perform a quantitative analysis (Step 1) and the goodwill impairment loss, if any, is measured as the amount by which a reporting unit’s carrying amount exceeds its fair value, not to exceed the carrying amount of goodwill. In general, the Company performs a quantitative test for most reporting units at least once every three years, or more frequently if deemed necessary by Management. During 2025, the Company performed a quantitative test for all of its reporting units and concluded that the fair value for the Space Europe reporting unit was below its carrying value. Therefore, the Company recognized $20.9 million of goodwill impairment during 2025. Please refer to Note H – Goodwill for further information.
The Company estimates the fair value of each reporting unit using a combination of a discounted cash flow (“DCF”) analysis and market-based valuation methodologies such as comparable public company trading values and values observed in recent business acquisitions. Determining fair value requires the exercise of significant judgments, including the amount and timing of expected future cash flows, long-term growth rates, discount rates and relevant comparable public company earnings multiples and transaction multiples. The cash flows employed in the DCF analysis are based on the Company best estimate of future revenues, gross margins, operating expenses, and cash flows with consideration for other factors, such as general market conditions, U.S. and foreign government budgets, existing contracted and uncontracted backlog, subcontractor agreements, changes in working capital, long-term business plans and historical operating performance. The discount rates utilized in the DCF analysis are based on the respective reporting unit’s weighted average cost of capital, which takes into account the relative weights of debt and equity components within the Company’s existing capital structure and represents the expected cost of new capital, adjusted as appropriate to consider the risk inherent in future cash flows of the respective reporting unit. The carrying value of each reporting unit includes the assets and liabilities employed in its operations, goodwill and allocations of certain assets and liabilities held at the corporate level. The Company compares the fair value of a reporting unit to its carrying value, including goodwill. If the fair value of a reporting unit exceeds its carrying value, goodwill of the reporting unit is not impaired. If the carrying value of the reporting unit, including goodwill, exceeds
REDWIRE CORPORATION
NOTES TO CONSOLIDATED FINANCIAL STATEMENTS
(Tabular amounts in thousands of U.S. dollars, except percentages, unit, share, and warrant amounts)
its fair value, a goodwill impairment loss is recognized in an amount equal to that excess.
During 2024 and 2023, the Company performed its annual impairment tests and concluded there were no indicators that the fair value of any reporting unit was more likely than not below carrying value. Therefore, no quantitative assessment was performed and no goodwill impairment was recognized during 2024 and 2023, respectively.
Derivative Financial Instruments
The Company evaluates its convertible instruments, options, warrants and other contracts to determine if those contracts or embedded components of those contracts qualify as derivatives. The classification of derivative instruments, including whether such instruments should be recorded as assets, liabilities, or equity, is reassessed at the end of each reporting period. For equity-linked financial instruments, the Company must determine whether the underlying instrument is indexed to its own common stock in order to classify the derivative instrument as equity. Otherwise, the derivative asset or liability, including embedded derivatives discussed below, is recognized at fair value with subsequent changes in fair value recognized in the consolidated statements of operations and comprehensive income (loss).
Private Warrants
Classification of the Company’s private warrants is based on management’s analysis of the guidance described above and a statement issued by the Staff of the Securities and Exchange Commission (“SEC”) regarding the accounting and reporting considerations for warrants issued by special purpose acquisition companies entitled “Staff Statement on Accounting and Reporting Considerations for Warrants Issued by Special Purpose Acquisition Companies.” The Company determined that the private warrants meet the definition of a derivative and, therefore, are classified as a liability measured at fair value, subject to remeasurement at each reporting period. The Company measures the private warrant liability at fair value each reporting period with the change in fair value recorded as other (income) expense, net in the consolidated statements of operations and comprehensive income (loss).
Hybrid instruments
Hybrid instruments issued in the form of a share requires bifurcation of embedded features if (a) the economic characteristics and risks of the embedded derivative instrument are not clearly and closely related to the economic characteristics and risks of the host contract, (b) the hybrid instrument that embodies both the embedded derivative instrument and the host contract is not re-measured at fair value under otherwise applicable generally accepted accounting principles with changes in fair value reported in earnings as they occur and (c) a separate instrument with the same terms as the embedded derivative instrument would be considered a derivative instrument. The nature of the host instrument is therefore evaluated to determine if it is more akin to a debt-like or equity-like host. In this assessment, the Company considers the stated and implied substantive features of the contract as well as the economic characteristics and risks of the hybrid instrument. Each term and feature is then weighed based on the relevant facts and circumstances to determine the nature of the host contract. Terms and features of the hybrid instrument (i.e. embedded derivatives) are then assessed to determine if they must be bifurcated and separately accounted for as freestanding derivatives. Examples of embedded derivatives include, among others, conversion options, redemption features, make-whole provisions, contingent increases in dividend rates and participation rights.
Convertible Preferred Stock
Accounting for convertible instruments and contracts in the Company’s own equity requires an evaluation of the hybrid security to determine if liability classification is required. Liability classification is required for freestanding financial instruments that are not debt in legal form and are: (1) subject to an unconditional obligation requiring the issuer to redeem the instrument by transferring assets (i.e. mandatorily redeemable), (2) instruments other than equity shares that embody an obligation of the issuer to repurchase its equity shares, or (3) certain types of instruments that obligate the issuer to issue a variable number of equity shares. Securities classified in temporary equity are initially measured at the proceeds received, net of issuance costs and excluding the fair value of bifurcated embedded derivatives (if any). Subsequent measurement of the carrying value is not required until such time that the contingencies are resolved and reclassification as a liability is required.
Revenue Recognition
The Company’s contracts are subject to revenue recognition using a five-step model, which involves (i) identification of the contract, (ii) identification of performance obligations in the contract, (iii) determination of the transaction price, (iv) allocation of the transaction price to the previously identified performance obligations, and (v) revenue recognition as the performance obligations are satisfied.
During step one of the five-step model, the Company considers whether contracts should be combined or separated, and based on this assessment, the Company combines closely related contracts when all the applicable criteria are met. The combination of two or more
REDWIRE CORPORATION
NOTES TO CONSOLIDATED FINANCIAL STATEMENTS
(Tabular amounts in thousands of U.S. dollars, except percentages, unit, share, and warrant amounts)
contracts requires judgment in determining whether the intent of entering into the contracts was effectively to enter into a single contract, which should be combined to reflect an overall profit rate. Similarly, the Company may separate an arrangement, which may consist of a single contract or group of contracts, with varying rates of profitability, only if the applicable criteria are met. Judgment is involved in determining whether a group of contracts may be combined or separated based on how the arrangement and the related performance criteria were negotiated. The conclusion to combine a group of contracts or separate a contract could change the amount of revenue and gross profit recorded in a given period.
A performance obligation is a promise in a contract to transfer a distinct good or service to the customer. A contract’s transaction price is allocated to each distinct performance obligation and recognized as revenue when the performance obligation is satisfied. The Company’s contracts with customers generally do not include a right of return relative to delivered products. In certain cases, contracts are modified to account for changes in the contract specifications or requirements. In most instances, contract modifications are accounted for as part of the existing contract. Certain contracts with customers have options for the customer to acquire additional goods or services. In most cases, the pricing of these options are reflective of the standalone selling price of the good or service. These options do not provide the customer with a material right and are accounted for only when the customer exercises the option to purchase the additional goods or services. If the option on the customer contract was not indicative of the standalone selling price of the good or service, the material right would be accounted for as a separate performance obligation.
The Company’s revenues are derived from the design and sales of components for spacecraft and satellites and the performance of engineering, modeling and simulation services related to spacecraft design and mission execution within the Space segment and combat-proven autonomous systems, optical sensors and radio frequency payloads that provide intelligence, surveillance, and reconnaissance capabilities within the Defense Tech segment. Each promised good or service within a contract is accounted for separately, if they are distinct. Promised goods or services not meeting the criteria for being a distinct performance obligation are bundled into a single performance obligation with other goods or services that together meet the criteria for being distinct. The appropriate allocation of the transaction price and recognition of revenue is then applied for the bundled performance obligation. The Company has concluded that its service contracts generally contain a single performance obligation given the interrelated nature of the activities which are significantly customized and not distinct within the context of the contract for substantially all of its contracts in the Space segment and a portion of its contracts in the Defense Tech segment.
Once the Company identifies the performance obligations, it determines the transaction price, which includes estimating the amount of variable consideration to be included in the transaction price, if any. The Company’s contracts generally do not contain penalties, credits, price concessions, or other types of potential variable consideration. Prices are fixed at contract inception and are not contingent on performance or any other criteria.
The Company engages in long-term contracts for production and service activities and recognizes revenue for performance obligations over time primarily in its Space segment. The Company considers the nature of these contracts and the types of products and services provided when determining the proper accounting for a particular contract. These contracts include both firm-fixed-price (“FFP”) and cost reimbursable contracts. The Company’s cost reimbursable contracts typically include cost-plus fixed fee (“CPFF”) and time-and-material (“T&M”) contracts. These long-term contracts involve the design, development, manufacture, or modification of components for spacecraft and satellites. For FFP and CPFF contracts, revenue is recognized over time (versus point in time recognition), as the Company’s performance creates an asset with no alternative use to the Company and the Company has an enforceable right to payment for performance completed to date, and the customer receives the benefit as the Company builds the asset. For T&M contracts and substantially all of its FFP and CPFF contracts in the Defense Tech segment, the Company recognizes revenue in the amount for which the Company has a right to invoice the customer based on the control transferred to the customer or point-in-time.
For long-term contracts in which revenue is recognized over time, the Company uses the input method, using a cost-to-cost measure of progress. The Company believes that this method represents the most faithful depiction of the Company’s performance because it directly measures value transferred to the customer. Contract estimates are based on various assumptions to project the outcome of future events that may span several years. These assumptions include, but are not limited to, the amount of time to complete the contract, including the assessment of the nature and complexity of the work to be performed; the cost and availability of materials; the availability of subcontractor services and materials; and the availability and timing of funding from the customer. The Company bears the risk of changes in estimates to complete on a fixed-price contract, which may cause profit levels to vary from period to period. For cost reimbursable contracts, the Company is reimbursed periodically for allowable costs and is paid a portion of the fee based on contract progress. In the limited instances where the Company enters into T&M contracts, revenue recognized reflects the number of direct labor hours expended in the performance of a contract multiplied by the contract billing rate, as well as reimbursement of other direct billable costs. For long-term contracts, the Company recognizes anticipated contract losses as soon as they become known and estimable.
REDWIRE CORPORATION
NOTES TO CONSOLIDATED FINANCIAL STATEMENTS
(Tabular amounts in thousands of U.S. dollars, except percentages, unit, share, and warrant amounts)
Accounting for long-term contracts requires significant judgment relative to estimating total contract revenues and costs, in particular, assumptions relative to the amount of time to complete the contract, including the assessment of the nature and complexity of the work to be performed. The Company’s estimates are based upon the professional knowledge and experience of its engineers, program managers and other personnel, who review each long-term contract monthly to assess the contract’s schedule, performance, technical matters and estimated cost at completion. Changes in estimates are applied retrospectively and when adjustments in estimated contract costs are identified, such revisions may result in current period adjustments to earnings applicable to performance in prior periods.
For long-term contracts, the portion of the payments retained by the customer is not considered a significant financing component. At contract inception, the Company also expects that the lag period between the transfer of a promised good or service to a customer and when the customer pays for that good or service will not constitute a significant financing component. Many of the Company’s long-term contracts have milestone payments, which align the payment schedule with the progress towards completion on the performance obligation. On some contracts, the Company may be entitled to receive an advance payment, which is not considered a significant financing component because it is used to facilitate inventory demands at the onset of a contract and to safeguard the Company from the failure of the other party to abide by some or all of their obligations under the contract.
Contract Balances
Contract balances result from the timing of revenue recognized, billings and cash collections, and the generation of contract assets and liabilities. Contract assets are presented as such on the Company’s consolidated balance sheets and represent revenue recognized in excess of amounts invoiced to the customer and the right to payment is not solely subject to the passage of time. Contract liabilities are presented as deferred revenue on the Company’s consolidated balance sheets and relate to advanced payments and billings in excess of revenues recognized and are recognized into revenue as the Company satisfies the underlying performance obligation, either over time as costs are incurred or as control is transferred to the customer.
Accounts Receivable
Accounts receivable are recorded for amounts to which the Company is entitled and has invoiced to the customer. The Company had a nominal amount of unbilled receivables as of December 31, 2025 and $3.5 million as of December 31, 2024. Unbilled receivables primarily consist of unbilled amounts under T&M contracts where billing and payment is subject solely to the passage of time.
Remaining Performance Obligations
The Company includes in its computation of remaining performance obligations customer orders for which it has accepted signed sales orders. The definition of remaining performance obligations excludes contracts accounted for under the “right to invoice” practical expedient.
Equity-based Compensation
The Company’s equity-based compensation plans are classified as equity plans and compensation expense is generally recognized over the vesting period of stock awards. The Company issues stock awards in the form of incentive units, non-qualified stock options, time-based restricted stock units, performance-based restricted stock units and eligibility to participate in the Employee Stock Purchase Plan (the “ESPP”). The fair value of incentive units and stock options are calculated on the grant date using the Black-Scholes Option Pricing Model (“OPM”). Given the absence of adequate historical data, the Company uses the simplified method to estimate the term of stock options granted to employees. The fair value of the time-based restricted stock units are calculated based on the closing market price of the Company’s common stock on the grant date. The fair value of the performance-based restricted stock units are valued using a Monte Carlo simulation model on the grant date.
The vesting of the incentive units is contingent on service-based, performance-based, and market conditions and, as such, the recognition of compensation expense is deferred until it is probable the performance conditions will be satisfied. Once it is probable that the performance conditions will be satisfied, unrecognized compensation expense is recognized based on the portion of the requisite service period that has been rendered. If the requisite period is complete, compensation expense is recognized regardless of market conditions being met.
For non-qualified stock options, time-based restricted stock units and performance-based restricted stock units, the Company recognizes the grant date fair value as compensation expense on a straight-line method over the vesting period (typically three years) and recognizes forfeitures as they occur.
The ESPP authorizes the grant of rights to employee participants to purchase the Company’s common stock through payroll deductions, up to 15% of their eligible compensation. The plan is a compensatory plan as it allows participants to purchase stock equal
REDWIRE CORPORATION
NOTES TO CONSOLIDATED FINANCIAL STATEMENTS
(Tabular amounts in thousands of U.S. dollars, except percentages, unit, share, and warrant amounts)
to 85% of the fair market value of the Company’s common stock at the beginning or end of each offering period, whichever is less (the “Discounted Value”). The ESPP is accounted for as an equity classified award. The Company recognizes the fair value of the ESPP award at the start of the offering period as compensation expense on a straight-line method over the offering period. The fair value of the ESPP award is comprised of the value of Discounted Value and the value associated with the variability in the Company’s common stock price during the offering period, which is estimated using the Black-Scholes model.
Income Taxes
The Company computes its provision for income taxes using the asset and liability method, under which deferred tax assets and liabilities are calculated based on the basis difference for financial reporting and tax basis of assets and liabilities using enacted tax rates for the year in which the differences are expected to reverse. All deferred income taxes are classified as non-current in the Company’s consolidated balance sheets. The Company records a valuation allowance against net deferred tax assets if, based upon the available evidence, it is more likely than not that some or all of the deferred tax assets will not be realized. The Company assesses the deferred tax assets for recoverability on a quarterly basis.
The Company recognizes a tax benefit only if it is more likely than not the tax position will be sustained on examination by the taxing authorities, based on the technical merits of the position. The tax benefits recognized in the financial statements from such positions are then measured based on the largest benefit that has a greater than 50% likelihood of being realized upon settlement. The Company recognizes interest and penalties accrued on any unrecognized tax benefits as a component of income tax expense.
Recently Adopted Accounting Pronouncements
In December 2023, the Financial Accounting Standards Board (“FASB”) issued Accounting Standards Update (“ASU”) No. 2023-09, Income Taxes (Topic 740): Improvements to Income Tax Disclosures (“ASU 2023-09”). This ASU requires a public business entity (“PBE”) to disclose, on an annual basis, a tabular rate reconciliation using both percentages and currency amounts, broken out into specified categories with certain reconciling items further broken out by nature and jurisdiction to the extent those items exceed a specified threshold. In addition, all entities are required to disclose income taxes paid, net of refunds received disaggregated by federal, state/local, and foreign, as well as by jurisdiction, if the amount is at least 5% of total income tax payments, net of refunds received. For PBEs, the new guidance is effective for annual periods beginning after December 15, 2024, with early adoption permitted. An entity may apply the amendments in this ASU prospectively by providing the revised disclosures for the period ending December 31, 2025 and continuing to provide the pre-ASU disclosures for the prior periods, or may apply the amendments retrospectively by providing the revised disclosures for all periods presented. The Company adopted this ASU prospectively for the period ending December 31, 2025, which only impacted our disclosures and had no impact on the Company’s results of operations, cash flows or financial condition.
Recently Issued Accounting Pronouncements
In September 2025, the FASB issued ASU No. 2025-06, Targeted Improvements to the Accounting for Internal-Use Software (Subtopic 350-40). This ASU removes references to prescriptive and sequential development stages, requiring companies to capitalize internal-use software costs when management commits to funding the software project and it is probable the project will be completed. The ASU will be effective for annual and interim periods beginning January 1, 2028, and can be applied on a prospective, modified prospective, or retrospective basis. We are currently evaluating the potential impact of adoption on the Company’s consolidated results of operations, cash flows and financial condition.
In November 2024, the FASB issued ASU No. 2024-03, Income Statement—Reporting Comprehensive Income—Expense Disaggregation Disclosures (Subtopic 220-40). This ASU requires disclosure, in the notes to financial statements, of specified information about certain costs and expenses, including purchases of inventory, employee compensation, depreciation, and intangible asset amortization included in each relevant expense caption. Additionally, the amendment requires a qualitative description of the amounts remaining in the relevant expense captions that are not separately disaggregated quantitatively, and the disclosure of the total amount of selling expenses and, in annual reporting periods, an entity’s definition of selling expenses. For PBEs, the new guidance is effective for annual reporting periods beginning after December 15, 2026, and interim reporting periods beginning after December 15, 2027, with early adoption permitted. An entity may apply the amendments prospectively for reporting periods after the effective date or retrospectively to any or all prior periods presented in the financial statements. The Company is currently evaluating the impact of adoption, which is expected to have an impact on disclosures only and no impact on the Company’s results of operations, cash flows or financial condition.
Other accounting standards updates adopted and/or issued, but not effective until after December 31, 2025, are not expected to have a material effect on the Company’s consolidated financial position, results of operations and/or cash flows.
REDWIRE CORPORATION
NOTES TO CONSOLIDATED FINANCIAL STATEMENTS
(Tabular amounts in thousands of U.S. dollars, except percentages, unit, share, and warrant amounts)
Note C – Business Combinations
Edge Autonomy Acquisition
On January 20, 2025, the Company entered into an agreement and plan of merger (as amended on February 3, 2025, and June 9, 2025, the “Merger Agreement”) with Edge Ultimate Holdings, LP, a Delaware limited partnership (“Ultimate Holdings”) to acquire 100% of the equity interests in Edge Autonomy Intermediate Holdings, LLC (together with its subsidiaries, “Edge Autonomy”), a leading provider of field-proven uncrewed airborne system (“UAS”) technology (the “Edge Acquisition”). On June 13, 2025, following the satisfaction of all regulatory approvals, including a stockholder vote, the acquisition was completed. Under the terms of the Merger Agreement Edge Autonomy emerged as the surviving entity and a wholly owned subsidiary of the Company. On the same day, the merger consideration was transferred, including $160.0 million in cash (“Cash Consideration”) and the issuance of 49,764,847 shares of the Company’s common stock (“Equity Consideration”). Common stock was held back from the Equity Consideration to fund post-closing purchase price adjustments, if any, in the amount of $5.0 million, valued at a price per share of $15.07. The Company funded the Cash Consideration using cash on hand and proceeds from its indebtedness. Refer to Note I – Debt for additional information on the Company’s outstanding debt.
The acquisition was accounted for as a business combination, whereby the excess of the consideration paid over the fair value of identifiable net assets was allocated to goodwill. The goodwill reflects the potential synergies and expansion of the Company’s offerings across product lines and markets complementary to its existing products and markets. For tax purposes, the goodwill is not deductible.
The following table summarizes the fair value of the consideration transferred and the estimated fair values of the major classes of assets acquired and liabilities assumed as of the acquisition date.
| | | | | |
| June 13, 2025 |
Cash consideration | $ | 160,000 | |
Fair value of common stock issued(1) | 862,561 | |
Equity holdback | 5,000 | |
Payable to Seller | 2,171 | |
Less: Working capital adjustment | 5,000 | |
Purchase consideration | $ | 1,024,732 | |
Assets: | |
Cash | $ | 8,209 | |
Accounts receivable and other receivable | 10,716 | |
Contract assets | 69 | |
| Inventory | 61,378 | |
| Prepaid expenses and other current assets | 6,614 | |
Property, plant and equipment | 26,271 | |
| Right-of-use assets | 14,822 | |
Intangible assets | 298,100 | |
| |
| |
| |
Total assets | 426,179 | |
| |
Liabilities: | |
Accounts payable | 5,627 | |
| |
| |
Accrued expenses | 11,910 | |
Deferred revenue | 26,111 | |
Other current liabilities | 938 | |
| Long-term operating lease liabilities | 14,973 | |
| |
| Deferred tax liabilities | 62,193 | |
| Other non-current liabilities | 1,019 | |
Total liabilities | 122,771 | |
Fair value of net identifiable assets acquired | 303,408 | |
| |
Goodwill | $ | 721,324 | |
(1) Fair value of the common stock issued is based on the Company’s common stock closing price of $19.08 on the acquisition date,
REDWIRE CORPORATION
NOTES TO CONSOLIDATED FINANCIAL STATEMENTS
(Tabular amounts in thousands of U.S. dollars, except percentages, unit, share, and warrant amounts)
June 13, 2025, less the fair value of the Edge Incentive Units of $87.0 million. Refer to Note R – Equity-Based Compensation for additional information on the Edge Incentive Units.
The following table summarizes the intangible assets acquired by class:
| | | | | | | | | | | |
| June 13, 2025 | | Weighted average useful life
in years |
Customer relationships | $ | 15,400 | | | 8 |
| Technology | 264,800 | | | 13 |
Trade name and trademark | 17,900 | | | 8 |
| | | |
| | | |
Total intangible assets | $ | 298,100 | | | |
The amounts above represent the final valuation analyses completed to assess the fair values of the assets acquired and liabilities assumed and the amount of goodwill to be recognized as of the acquisition date. These fair values were based on management’s estimates and assumptions.
The fair values of identifiable intangible assets were determined by using certain estimates and assumptions that are not observable in the market. The fair value of the acquired technology and trademark and trade name was estimated using the relief from royalty method. The significant assumptions used to estimate the fair value included forecasted revenues, expected royalty rates, and discount rates. The fair value of the acquired customer relationships was estimated using the multi-period excess earnings method. The significant assumptions used to estimate the fair value of customer relationships included forecasted revenues, expected customer attrition rates, and discount rates.
The results of operations of Edge Autonomy have been included in the Company’s consolidated results of operations since the date of acquisition, June 13, 2025 and are reported in our Defense Tech segment. The table below presents the revenues and net income (loss) of Edge Autonomy included in the consolidated statements of operations and comprehensive income (loss) since the acquisition date, for the following periods:
| | | | | | | |
| | | Year Ended |
| | | | December 31, 2025 |
Post-acquisition revenues | | | $ | 107,114 | |
| Net income (loss) attributable to Redwire Corporation | | | (78,453) | |
| | | |
Pro Forma Financial Data (Unaudited)
The table below presents the pro forma combined results of operations for the Company for the years ended December 31, 2025 and 2024, as though the acquisition of Edge Autonomy had been completed as of January 1, 2024.
| | | | | | | | | | | | | | | |
| | | Year Ended |
| | | | | December 31, 2025 | | December 31, 2024 |
Revenues | | | | | $ | 422,249 | | | $ | 499,084 | |
| Net income (loss) attributable to Redwire Corporation | | | | | (179,634) | | | (232,633) | |
The amounts included in the pro forma financial information are based on historical results and do not necessarily represent what would have occurred if the Edge Acquisition had taken place as of January 1, 2024, nor do they represent results that may occur in the future. Accordingly, the pro forma financial information should not be relied upon as being indicative of the results that would have been realized had the business combination occurred as of the date indicated or that may be achieved in the future.
Other Acquisitions
On August 30, 2024, the Company acquired 100% of the equity interests of Hera Systems, Inc. (“Hera”), a spacecraft developer focused on specialized missions for national security space customers. Hera’s primary operations include developing high-performance spacecraft to support the evolving requirements for national security missions operating in contested space. Hera’s advanced platform incorporates cyber-secure communications, resilient power systems, highly accurate pointing, extensive maneuverability and massive on-board computing power supporting mission- and payload-specific machine learning. This acquisition was not material individually to the Company’s financial position nor the results of operations for the periods presented in the Company’s consolidated balance sheets and consolidated statements of operations and comprehensive income (loss), respectively. Therefore, the pro forma operating results and other disclosures for the Hera acquisition are not presented.
REDWIRE CORPORATION
NOTES TO CONSOLIDATED FINANCIAL STATEMENTS
(Tabular amounts in thousands of U.S. dollars, except percentages, unit, share, and warrant amounts)
The Company incurred acquisition related costs for completed acquisitions of $21.0 million and $5.0 million during the years ended December 31, 2025 and 2024, respectively, and incurred nominal costs for the year ended December 31, 2023. These expenses are included in transaction expenses on the consolidated statements of operations and comprehensive income (loss).
Note D – Fair Value of Financial Instruments
Cash, cash equivalents and restricted cash, accounts receivable, contract assets, inventories, prepaid expenses and other current assets, accounts payable, accrued expenses, deferred revenue and other current liabilities are reflected on the consolidated balance sheets at amounts that approximate fair value because of the short-term nature of these financial assets and liabilities.
The fair value of the Company’s debt approximates its carrying value and is classified as Level 2 within the fair value hierarchy as it is based on discounted cash flows using a current borrowing rate.
Private Warrants
In September 2021, the Company issued 7,732,168 private warrants in a transaction exempt from registration under securities regulations. The warrants, which are not listed for trading on a stock exchange, entitle the holder to purchase one share of the Company’s common stock at an exercise price of $11.50 per share, subject to adjustment. The warrants will expire on September 2, 2026, at 5:00 p.m., New York City time, or earlier upon redemption or liquidation. The private warrants were established as a liability at issuance. Classification of the private warrants as liability instruments was based on an analysis of the guidance in accordance with U.S. GAAP and a statement issued by the Staff of the SEC regarding the accounting and reporting considerations for warrants issued by special purpose acquisition companies entitled “Staff Statement on Accounting and Reporting Considerations for Warrants Issued by Special Purpose Acquisition Companies.” The Company considered whether the private warrants display the three characteristics of a derivative, and concluded the private warrants meet the definition of a derivative. However, the private warrants fail to meet the equity scope exception and thus are classified as a liability measured at fair value, subject to remeasurement at each reporting period. The changes in fair value of the private warrant liability were a decrease of $16.1 million and an increase of $52.0 million for the years ended December 31, 2025 and 2024, respectively. These changes in fair value are recognized as other (income) expense, net in the consolidated statements of operations and comprehensive income (loss).
During the year ended December 31, 2025, 4,631,799 private warrants were exercised on a cashless basis for 2,293,739 shares of the Company’s common stock. Additionally, during the year ended December 31, 2025, 467,174 private warrants were exercised and converted into 467,174 shares of the Company’s common stock at the exercise price of $11.50 per share for proceeds of $5.4 million. Upon exercise, the Company remeasured the fair value of the related private warrants, which was recognized as other (income) expense, net in the consolidated statements of operations and comprehensive income (loss), and then released the associated liability upon issuance of the Company’s common stock. Refer to Note K – Warrants and Capital Stock Transactions for additional information.
The private warrants were valued using a modified Black-Scholes OPM. As certain inputs are not observable in the market, the private warrants are classified as Level 3 instruments within the fair value hierarchy. The table below presents the fair value per warrant and the valuation assumptions under the Black-Scholes OPM:
| | | | | | | | | | | | | | | | | | | |
| | | December 31, 2025 | | February 25, 2025 | | December 31, 2024 |
| Fair value per share | | | $ | 1.60 | | | $ | 6.84 | | | $ | 7.15 | |
| Warrants outstanding | | | 2,633,195 | | | 5,098,978 | | | 7,732,168 | |
| Exercise price | | | $ | 11.50 | | | $ | 11.50 | | | $ | 11.50 | |
| Common stock price | | | $ | 7.60 | | | $ | 14.34 | | | $ | 16.46 | |
| Expected option term | | | 0.7 years | | 1.5 years | | 1.7 years |
| Expected volatility | | | 104.60 | % | | 82.90 | % | | 52.70 | % |
| Risk-free rate of return | | | 3.52 | % | | 4.05 | % | | 4.18 | % |
| Expected annual dividend yield | | | — | % | | — | % | | — | % |
REDWIRE CORPORATION
NOTES TO CONSOLIDATED FINANCIAL STATEMENTS
(Tabular amounts in thousands of U.S. dollars, except percentages, unit, share, and warrant amounts)
The table below presents the Company’s financial instruments measured at fair value on a recurring basis:
| | | | | | | | | | | | | | | | | | | | | | | | | | | | | |
| | | |
| | | | December 31, 2025 |
| | Balance Sheet Location | | Level 1 | | Level 2 | | Level 3 | | Total |
| | | | | | | | | |
| | | | | | | | | |
| | | | | | | | | |
| | | | | | | | | |
| | | | | | | | | |
Liabilities: | | | | | | | | | |
| Private warrants | Warrant liabilities | | $ | — | | | $ | — | | | $ | 4,213 | | | $ | 4,213 | |
| | | | | | | | | |
| Total liabilities | | | $ | — | | | $ | — | | | $ | 4,213 | | | $ | 4,213 | |
| | | | | | | | | |
| | | |
| | | December 31, 2024 |
| Balance Sheet Location | | Level 1 | | Level 2 | | Level 3 | | Total |
| | | | | | | | | |
| | | | | | | | | |
| | | | | | | | | |
| | | | | | | | | |
| | | | | | | | | |
Liabilities: | | | | | | | | | |
| Private warrants | Warrant liabilities | | $ | — | | | $ | — | | | $ | 55,285 | | | $ | 55,285 | |
| | | | | | | | | |
| Total liabilities | | | $ | — | | | $ | — | | | $ | 55,285 | | | $ | 55,285 | |
Changes in the fair value of Level 3 financial liabilities were as follows:
| | | | | | | | | | | | | |
| Liabilities: | | | Private Warrants | | Total Level 3 |
| | | | | |
| | | | | |
| | | | | |
| | | | | |
| | | | | |
| | | | | |
| | | | | |
| | | | | |
| | | | | |
| | | | | |
| | | | | |
| | | | | |
| | | | | |
| | | | | |
| | | | | |
| | | | | |
| | | | | |
| | | | | |
| | | | | |
| | | | | |
| | | | | |
| | | | | |
| | | | | |
| | | | | |
| | | | | |
| December 31, 2023 | | | $ | 3,325 | | | $ | 3,325 | |
| | | | | |
Changes in fair value | | | 51,960 | | | 51,960 | |
| | | | | |
| December 31, 2024 | | | $ | 55,285 | | | $ | 55,285 | |
| | | | | |
Changes in fair value | | | (16,109) | | | (16,109) | |
Settlements | | | (34,963) | | | (34,963) | |
| December 31, 2025 | | | $ | 4,213 | | | $ | 4,213 | |
Note E – Inventory, net
The inventory balance was as follows:
| | | | | | | | | | | |
| |
| December 31, 2025 | | December 31, 2024 |
| Raw materials | $ | 32,634 | | | $ | 1,812 | |
| Work in process | 20,193 | | | 427 | |
| Finished goods | 3,020 | | | — | |
| | | |
Inventory, net | $ | 55,847 | | | $ | 2,239 | |
The Company records a reserve for slow-moving inventory as a charge against earnings for all products identified as surplus, slow-moving, or discontinued. The amounts presented above are shown net of inventory reserves of $2.4 million as of December 31, 2025. The Company had no inventory reserves as of December 31, 2024.
REDWIRE CORPORATION
NOTES TO CONSOLIDATED FINANCIAL STATEMENTS
(Tabular amounts in thousands of U.S. dollars, except percentages, unit, share, and warrant amounts)
Note F – Property, Plant and Equipment, net
Property, plant and equipment, net were as follows:
| | | | | | | | | | | | | | | | | | | | | | | | | | | | | | | | | | | |
| | | | | |
| | December 31, 2025 | | December 31, 2024 |
| North America | | Europe | | Total | | North America | | Europe | | Total |
Computer equipment | $ | 4,025 | | | $ | 962 | | | $ | 4,987 | | | $ | 2,690 | | | $ | 695 | | | $ | 3,385 | |
Furniture and fixtures | 2,610 | | | 1,334 | | | 3,944 | | | 1,409 | | | 36 | | | 1,445 | |
Machinery and Laboratory equipment | 29,496 | | | 5,503 | | | 34,999 | | | 6,879 | | | 728 | | | 7,607 | |
| | | | | | | | | | | |
Leasehold improvements | 10,503 | | | 4,295 | | | 14,798 | | | 2,576 | | | 4,410 | | | 6,986 | |
Vehicles | 81 | | | — | | | 81 | | | 81 | | | — | | | 81 | |
| Finance lease ROU assets | — | | | 3,567 | | | 3,567 | | | — | | | 2,313 | | | 2,313 | |
| Construction in process | 1,010 | | | 371 | | | 1,381 | | | 5,648 | | | — | | | 5,648 | |
| Property, plant and equipment, gross | 47,725 | | | 16,032 | | | 63,757 | | | 19,283 | | | 8,182 | | | 27,465 | |
Less: accumulated depreciation | (11,498) | | | (3,060) | | | (14,558) | | | (6,147) | | | (3,481) | | | (9,628) | |
| Total property, plant and equipment, net | $ | 36,227 | | | $ | 12,972 | | | $ | 49,199 | | | $ | 13,136 | | | $ | 4,701 | | | $ | 17,837 | |
| | | | | | | | | | | |
| | | | | | | | | | | |
| | | | | | | | | | | |
The Company observed a significant decline in discounted future cash flows, specifically in the Space Europe reporting unit, primarily attributable to a decrease in forecasted revenues as well as increased production costs that have reduced margins of existing performance obligations and encountered deferred pipeline realization. After considering the totality of events and circumstances, the Company determined that these triggering events indicated that certain recorded long-lived assets, including property, plant and equipment and finite-lived intangibles may be impaired. As a result, the Company performed a quantitative impairment assessment of asset groups within the Space Europe reporting unit as of October 1, 2025 and determined that the carrying value of one asset group was not recoverable based on entity-specific, undiscounted net cash flows. Accordingly, impairment expense was measured as the amount by which the carrying value of the asset groups exceeded their fair value as of the assessment date. The fair value of the asset group was determined using an income approach based on a discounted cash flow model, which resulted in an impairment of certain tangible and intangible assets recorded on the underlying asset group. Based on the results of the quantitative impairment test performed during 2025, the Company recognized impairment expense related to furniture and fixtures, machinery and equipment and leasehold improvements of $2.6 million.
There was no impairment recognized related to property, plant and equipment during the years ended December 31, 2024 and 2023.
The table below presents the depreciation expense related to property, plant and equipment for the following periods:
| | | | | | | | | | | | | | | | | | | | | | |
| | | | | | | | |
| | | | | Year Ended |
| | | | | | December 31, 2025 | | December 31, 2024 | | | December 31, 2023 |
Depreciation expense | | | | | $ | 7,849 | | | $ | 4,067 | | | | $ | 3,512 | |
| | | | | | | | | | |
REDWIRE CORPORATION
NOTES TO CONSOLIDATED FINANCIAL STATEMENTS
(Tabular amounts in thousands of U.S. dollars, except percentages, unit, share, and warrant amounts)
Note G – Intangible Assets, net
The intangible assets gross carrying amount and accumulated amortization were as follows: | | | | | | | | | | | | | | | | | | | | | | | |
| |
| December 31, 2025 |
| Gross
carrying
amount | | Accumulated
amortization | | Net
carrying
amount | | Weighted average
useful life
in years |
Finite-lived intangible assets: | | | | | | | |
Customer relationships | $ | 47,380 | | | $ | (15,890) | | | $ | 31,490 | | | 16 |
Technology | 293,695 | | | (22,319) | | | 271,376 | | | 13 |
Trademarks | 21,072 | | | (3,005) | | | 18,067 | | | 8 |
| | | | | | | |
| Internal-use software licenses | 17,054 | | | (4,978) | | | 12,076 | | | 6 |
In-process internal-use software | 2,844 | | | — | | | 2,844 | | | |
Indefinite-lived intangible assets: | | | | | | | |
Cosmos Tradename | 300 | | | — | | | 300 | | | |
| | | | | | | |
Total intangible assets | $ | 382,345 | | | $ | (46,192) | | | $ | 336,153 | | | |
| | | | | | | | | | | | | | | | | | | | | | | | |
| |
| | December 31, 2024 |
| | Gross
carrying
amount | | Accumulated
amortization | | Net
carrying
amount | | | Weighted average
useful life
in years |
Finite-lived intangible assets: | | | | | | | | |
Customer relationships | $ | 39,606 | | | $ | (8,403) | | | $ | 31,203 | | | | 21 |
Technology | 33,379 | | | (12,351) | | | 21,028 | | | | 15 |
Trademarks | 3,172 | | | (2,050) | | | 1,122 | | | | 9 |
| Internal-use software licenses | 8,760 | | | (3,116) | | | 5,644 | | | | 6 |
In-process internal-use software | 2,491 | | | — | | | 2,491 | | | | |
Indefinite-lived intangible assets: | | | | | | | | |
Cosmos Tradename | 300 | | | — | | | 300 | | | | |
| | | | | | | | |
Total intangible assets | $ | 87,708 | | | $ | (25,920) | | | $ | 61,788 | | | | |
As disclosed in Note F – Property, Plant and Equipment, net, the Company identified triggering events indicating that certain recorded long-lived assets, including property, plant and equipment and finite-lived intangibles may be impaired. As a result, the Company performed a quantitative impairment assessment of asset groups within the Space Europe reporting unit as of October 1, 2025 and determined that the carrying value of one asset group was not recoverable based on entity-specific, undiscounted net cash flows. Accordingly, impairment expense was measured as the amount by which the carrying value of the asset groups exceeded their fair value as of the assessment date. The fair value of the asset group was determined using an income approach based on a discounted cash flow model, which resulted in an impairment of certain tangible and intangible assets recorded on the underlying asset group. Based on the results of the quantitative impairment test performed during 2025, the Company recognized impairment expense related to customer relationships and technology finite-lived intangible assets of $10.9 million.
There was no impairment recognized related to intangible assets during the years ended December 31, 2024 and 2023.
The table below presents the amortization expense related to intangible assets for the following periods: | | | | | | | | | | | | | | | | | | | | | | |
| | | | | | | | |
| | | | | Year Ended |
| | | | | | December 31, 2025 | | December 31, 2024 | | | December 31, 2023 |
Amortization expense | | | | | $ | 24,790 | | | $ | 7,625 | | | | $ | 7,212 | |
REDWIRE CORPORATION
NOTES TO CONSOLIDATED FINANCIAL STATEMENTS
(Tabular amounts in thousands of U.S. dollars, except percentages, unit, share, and warrant amounts)
The table below presents the future amortization expense on intangible assets as of December 31, 2025: | | | | | |
| Year | Total |
| 2026 | $ | 49,850 | |
| 2027 | 53,524 | |
| 2028 | 43,528 | |
| 2029 | 37,701 | |
| 2030 | 34,668 | |
| Thereafter | 113,738 | |
| Total future amortization expense on intangible assets | $ | 333,009 | |
Note H – Goodwill
The changes in the carrying amount of goodwill were as follows: | | | | | | | | | | | | | | | | | | | | | | | | | | | | | | | | | | | | | | | | | |
| | | | | | | | | | | | | |
| Gross Goodwill | | Accumulated Impairment | | Net Goodwill |
| Space | | Defense Tech | | Space | | Defense Tech | | Space | | Defense Tech | | Total |
| | | | | | | | | | | | | |
| | | | | | | | | | | | | |
| | | | | | | | | | | | | |
| | | | | | | | | | | | | |
| | | | | | | | | | | | | |
| | | | | | | | | | | | | |
| | | | | | | | | | | | | |
| | | | | | | | | | | | | |
| | | | | | | | | | | | | |
| | | | | | | | | | | | | |
| | | | | | | | | | | | | |
| | | | | | | | | | | | | |
| | | | | | | | | | | | | |
| | | | | | | | | | | | | |
| | | | | | | | | | | | | |
Balance of goodwill as of December 31, 2023 | $ | 88,321 | | | $ | 27,566 | | | $ | (50,130) | | | $ | — | | | $ | 38,191 | | | $ | 27,566 | | | $ | 65,757 | |
| Goodwill arising from acquisitions | 6,629 | | | — | | | — | | | — | | | 6,629 | | | — | | | 6,629 | |
| Impact of foreign currency | (1,438) | | | — | | | 213 | | | — | | | (1,225) | | | — | | | (1,225) | |
| | | | | | | | | | | | | |
| | | | | | | | | | | | | |
| | | | | | | | | | | | | |
Balance of goodwill as of December 31, 2024 | 93,512 | | | 27,566 | | | (49,917) | | | — | | | 43,595 | | | 27,566 | | | 71,161 | |
| Goodwill arising from acquisitions | — | | | 721,324 | | | — | | | — | | | — | | | 721,324 | | | 721,324 | |
Goodwill reallocation | 11,901 | | | (11,901) | | | — | | | — | | | 11,901 | | | (11,901) | | | — | |
| Impact of foreign currency | 2,891 | | | 5,064 | | | (428) | | | — | | | 2,463 | | | 5,064 | | | 7,527 | |
| | | | | | | | | | | | | |
| Impairment expense | — | | | — | | | (20,898) | | | — | | | (20,898) | | | — | | | (20,898) | |
Balance of goodwill as of December 31, 2025 | $ | 108,304 | | | $ | 742,053 | | | $ | (71,243) | | | $ | — | | | $ | 37,061 | | | $ | 742,053 | | | $ | 779,114 | |
During the fourth quarter of 2025, the Company performed a quantitative assessment of goodwill for its annual goodwill impairment test as of October 1, 2025. As a result of the assessment, the Company concluded that the carrying value of the Space Europe reporting unit was in excess of its fair value and recognized a $20.9 million impairment charge for the year ended December 31, 2025, reducing the reporting unit’s goodwill balance to zero as of December 31, 2025. The Space Europe reporting unit is included in the Space segment. An impairment was also recognized on certain tangible and intangible assets for certain asset groups within the reporting unit. Refer to Note F – Property, Plant and Equipment, net and Note G – Intangible Assets, net for additional information.
Fair value estimates used in the Company’s quantitative impairment assessments result from a complex series of judgments about future events and uncertainties and rely heavily on estimates and assumptions that have been deemed reasonable by management as of the measurement date. The fair values of the Company’s reporting units were determined using a combination and applied weighting of an income approach based on a discounted cash flow model as well as two market approaches based on (i) guideline public company revenues and earnings before interest, tax, depreciation and amortization multiples and (ii) guideline transactions, whereby consideration is given to prices paid in market comparable transactions.
There was no impairment recognized related to goodwill during 2024 and 2023.
Effective December 2025, in connection with the change in reportable operating segments, the Company reassessed its reporting units and identified six reporting units, Space Mission Solutions, Space US, Space Europe, Space Defense Tech, North America Defense Tech, and Europe Defense Tech. As a result, the Company allocated the goodwill balance to each reporting unit and respective reportable operating segments during December 2025. Space Mission Solutions, Space U.S. and Space Europe are within the Space segment and Space Defense Tech, North America Defense Tech, and Europe Defense Tech are within the Defense Tech segment.
REDWIRE CORPORATION
NOTES TO CONSOLIDATED FINANCIAL STATEMENTS
(Tabular amounts in thousands of U.S. dollars, except percentages, unit, share, and warrant amounts)
Note I – Debt
The table below presents details of the Company’s debt as of the following periods and the effective interest rate as of December 31, 2025:
| | | | | | | | | | | | | | | | | |
| | | |
| | Effective interest rate | | December 31, 2025 | | December 31, 2024 |
Adams Street Term Loan | — | % | | $ | — | | | $ | 30,212 | |
Adams Street Delayed Draw Term Loan | — | | | — | | | 14,619 | |
Adams Street Incremental Term Loan | — | | | — | | | 31,268 | |
Adams Street Revolving Credit Facility | — | | | — | | | 50,000 | |
JPMorgan Term Loan | 13.31 | | | 87,750 | | | — | |
| | | | | |
| | | | | |
Other financing loans | 3.43 | | | 662 | | | 486 | |
Total debt | | | 88,412 | | | 126,585 | |
Less: unamortized discounts and issuance costs | | | 3,214 | | | 855 | |
Total debt, net | | | 85,198 | | | 125,730 | |
Less: Short-term debt, including current portion of long-term debt | | | 5,162 | | | 1,266 | |
Total long-term debt, net | | | $ | 80,036 | | | $ | 124,464 | |
Adams Street Credit Agreement
On October 28, 2020, the Company entered into a credit agreement with Adams Street Capital (the “Adams Street Credit Agreement”), the terms of which were subsequently modified by various amendments through December 31, 2025. As amended, the Adams Street Credit Agreement includes (i) a $31.0 million term loan commitment, (ii) a $15.0 million delayed draw term loan, (iii) a $32.0 million incremental term loan, and (iv) a $65.0 million revolving credit facility commitment, all of which mature on April 28, 2027. During the year ended December 31, 2025, the Company borrowed $5.0 million and repaid $55.0 million on the revolving credit facility. As of December 31, 2025, the Company had $35.0 million of remaining capacity under the Company’s revolving credit facility.
As of December 31, 2025, the outstanding principal under the Adams Street Credit Agreement incurs cash interest in accordance with the base rate plus the applicable rates as set forth in the table below:
| | | | | | | | | | | |
| | Term SOFR Rate | | Base Rate |
Term loans | 6.00 | % | | 5.00 | % |
| Revolving credit facility: | | | |
Aggregate principal of $5.0 million or less | 6.00 | | | 5.00 | |
Aggregate principal in excess of $5.0 million | 7.50 | | | 6.50 | |
As amended in March 2022, AE Industrial Partners Fund II, LP (“AEI Fund II”) and certain of its affiliates (the “AEI Guarantors”), provided a limited guarantee for the payment of outstanding revolving loans in excess of $10.0 million, with a $15.0 million cap in the aggregate. In the event that the AEI Guarantors are required to make payments to the lenders under the Adams Street Credit Agreement pursuant to the terms of the limited guarantee, each AEI Guarantor would be subrogated to the rights of the lenders. In connection with the limited guarantee, the Company agreed to pay to the AEI Guarantors a fee equal to 2% of any amount actually paid by such guarantors under the limited guarantee. The fee is waivable by the AEI Guarantors at their discretion.
In June 2024, the Company entered into an Eighth Amendment to the Adams Street Credit Agreement (the “Eighth Amendment”), in which the commitments under the revolving credit facility increased from $30.0 million to $45.0 million. Pursuant to the Eighth Amendment, the Company is required to maintain an aggregate principal amount of outstanding revolving credit loans of no less than $10.0 million. In August 2024, the Company entered into a Ninth Amendment to the Adams Street Credit Agreement (the “Ninth Amendment”), in which the commitments under the revolving credit facility increased from $45.0 million to $65.0 million. Pursuant to the Ninth Amendment, the aggregate principal amount of outstanding revolving credit loans the Company is required to maintain increased from no less than $10.0 million to no less than $30.0 million.
In June 2025, the Company entered into a Tenth Amendment to the Adams Street Credit Agreement (the “Tenth Amendment”) in which, (i) the maturity date was extended to April 28, 2027, (ii) the interest rate of the term loans will be increased to match the
REDWIRE CORPORATION
NOTES TO CONSOLIDATED FINANCIAL STATEMENTS
(Tabular amounts in thousands of U.S. dollars, except percentages, unit, share, and warrant amounts)
interest rate under the JPMorgan Credit Agreement (as defined below), commencing on January 1, 2026, and (iii) Adams Street Capital was granted a second-priority lien on the equity interests of Edge Autonomy, the Company’s wholly owned subsidiary. In connection with the Tenth Amendment, the Company incurred a nominal amount of fees paid to the lender and third-parties. Fees paid to the lender were recorded as a discount on the related facility, while costs paid to third-parties were expensed as incurred and recorded as other (income) expense in the condensed consolidated statements of operations and comprehensive income (loss).
On December 31, 2025, the Company repaid the remaining outstanding principal and interest balances of the Adams Street term loan, incremental term loan and delayed draw term loan in the aggregate amount of $75.5 million and $1.0 million, respectively, with the proceeds received from sales of the Company’s common stock through the at-the-market (“ATM”) facility. Additionally, on December 31, 2025, the Company also used a portion of the proceeds from the ATM facility to repay the $30.0 million outstanding balance on the revolving credit facility commitment, which also reduced the facility’s commitment to $35.0 million on the same date. The early repayment of the term loans was treated as extinguishment of debt and the decrease in the revolving credit facility commitment was treated as a modification. As a result, the unamortized discount and issuance costs related to the term loans and a portion of unamortized issuance costs related to the revolving credit facility were written off in the aggregate amount of $1.0 million as loss on extinguishment of debt in the consolidated statements of operations and comprehensive income (loss) for the year ended December 31, 2025. Refer to Note K – Warrants and Capital Stock Transactions for additional information related to the Company’s ATM activity.
The Adams Street Credit Agreement, as amended, contains certain customary representations and warranties, affirmative and other covenants and events of default, including among other things, payment defaults, breach of representations and warranties, and covenant defaults. As of December 31, 2025 and December 31, 2024, the Company was in compliance with its covenant requirements, as amended.
JPMorgan Chase Credit Agreement
In June 2025, the Company’s wholly owned subsidiary, Edge Intermediate Holdings, LLC, entered into a credit agreement with JPMorgan Chase Bank, N.A. (the “JPMorgan Credit Agreement”) which includes a $90.0 million term loan that matures on April 28, 2027. As of December 31, 2025, the outstanding principal under the JPMorgan Credit Agreement incurs cash interest, which is payable quarterly at a rate equal to the SOFR rate plus an applicable per annum rate of 6.5% through December 31, 2025 and 7.0% from January 1, 2026 through maturity. Under the terms of the JPMorgan Credit Agreement, the Company will make principal payments in the amount of 1.25% of the original outstanding term loan quarterly until maturity at which time the remaining principal balance becomes due in full. The JPMorgan Credit Agreement contains certain customary representations and warranties, affirmative and other covenants and events of default, including among other things, payment defaults, breach of representations and warranties, and covenant defaults. In connection with the issuance of the JPMorgan Credit Agreement, the Company incurred $4.2 million of fees paid to the lender and debt issuance costs, which were recorded as a discount on the related term loan and are being amortized over the term of the loan using the effective interest method. As of December 31, 2025, the Company was in compliance with its covenant requirements.
Seller Note
In June 2025, the Company entered into an unsecured promissory note agreement with Ultimate Holdings (an affiliate of AE Industrial Partners and former parent of Edge Autonomy) (the “Seller Note”), which included a note payable of $100.0 million. The Seller Note was used to finance a portion of the cash consideration of the Edge Autonomy acquisition. The Seller Note had a 3.0% upfront fee that was paid-in-kind and added to the principal amount, which was fully earned at maturity as described below. The Seller Note also had a minimum return payment that was equal to 1.20 times the original principal amount if it was repaid prior to December 31, 2025, less any aggregate cash payments of principal, interest (including paid-in-kind interest) and the upfront fee previously or then being paid in cash. The upfront fee and minimum return payment were recorded as a discount on the related term loan and were being amortized over the term of the loan using the effective interest method. The Seller Note accrued interest at an annual rate of 15.0% through December 31, 2025 and 18.0% thereafter which was payable quarterly either in cash or in-kind, at the Company’s option. The Seller Note had a maturity that was the earliest of (i) a change in control or a sale of all or substantially all of the Company’s assets; (ii) the date that is ninety-one (91) days following the maturity date of the Adams Street Credit Agreement or JPMorgan Credit Agreement; and (iii) acceleration following an event of default as defined within the agreement. The Seller Note also provided that if the Company received any equity financing net proceeds, 100.0% of such proceeds, to the extent available, must be applied to the prepayment of the Seller Note in cash.
In June 2025, the Company completed an equity raise and issued 15,525,000 shares of common stock at a price of $16.75 per share for net proceeds of $245.0 million. In accordance with the terms of the Seller Note, the Company used $120.0 million of these proceeds to
REDWIRE CORPORATION
NOTES TO CONSOLIDATED FINANCIAL STATEMENTS
(Tabular amounts in thousands of U.S. dollars, except percentages, unit, share, and warrant amounts)
repay the Seller Note in full, inclusive of the minimum return payment as described above. As a result of the repayment, the Company recorded interest expense of $20.0 million for the year ended December 31, 2025.
The maturities of the Company’s long-term debt outstanding as of December 31, 2025 are as follows:
| | | | | | | | | | | | | | | | | | | | | | | | | | | | | | | | | | | | | | | | | |
| | | | | | | | | | | | | |
| 2026 | | 2027 | | 2028 | | 2029 | | 2030 | | Thereafter | | Total |
| | | | | | | | | | | | | |
| | | | | | | | | | | | | |
| | | | | | | | | | | | | |
| | | | | | | | | | | | | |
JPMorgan Term Loan | $ | 4,500 | | | $ | 83,250 | | | $ | — | | | $ | — | | | $ | — | | | $ | — | | | $ | 87,750 | |
Other Financing Loan | 662 | | | — | | | — | | | — | | | — | | | — | | | 662 | |
| | | | | | | | | | | | | |
Total long-term debt maturities | $ | 5,162 | | | $ | 83,250 | | | $ | — | | | $ | — | | | $ | — | | | $ | — | | | $ | 88,412 | |
The table below presents the interest expense on debt, including the amortization of discounts and issuance costs for the following periods:
| | | | | | | | | | | | | | | | | | | | | | |
| | | | | | | | |
| | | Year Ended |
| | | | | December 31, 2025 | | December 31, 2024 | | | December 31, 2023 |
| Interest expense on debt | | | | | $ | 39,766 | | | $ | 13,484 | | | | $ | 10,702 | |
Note J – Leases
The Company has entered into and acquired long-term leasing arrangements for the right to use various classes of underlying assets, including facilities, vehicles and office equipment. Certain facility leases contain predetermined fixed escalation of minimum rents at stated rates ranging from 1.00% to 25.00% per annum and three leases with annual escalations based on certain price indices. In addition, certain facility leases include renewal options that could extend the lease term for up to an additional fifteen years. The office equipment lease contains a renewal option that could extend the lease to consecutive 60-day terms and a purchase option.
Total Lease Costs
The following table summarizes total lease costs for the period:
| | | | | | | | | | | | | | | | | | | | | | | |
| | | | | | | | | |
| | | Year Ended | |
| | | | | December 31, 2025 | | December 31, 2024 | | | December 31, 2023 | |
| Finance lease cost: | | | | | | | | | | | |
| Amortization of ROU assets | | | | | $ | 576 | | | $ | 518 | | | | $ | 434 | | |
| Interest on lease liabilities | | | | | 118 | | | 122 | | | | $ | 98 | | |
| Operating lease costs | | | | | 8,343 | | | 4,637 | | | | $ | 4,251 | | |
| Variable lease costs | | | | | 66 | | | 48 | | | | $ | 29 | | |
| Short-term lease costs | | | | | 638 | | | 475 | | | | $ | 230 | | |
| Total lease costs | | | | | $ | 9,741 | | | $ | 5,800 | | | | $ | 5,042 | | |
| | | | | | | | | | | |
| | | | | | | | | | | |
Total lease costs are included in selling, general and administrative expenses and cost of sales on the consolidated statements of operations and comprehensive income (loss).
During the year ended December 31, 2025, the Company abandoned a leased facility and recognized impairment expense of $0.3 million related to ROU assets. There was no impairment recognized related to ROU assets during the years ended December 31, 2024 and 2023.
As of December 31, 2025, the Company had one facility lease that had not yet commenced but requires significant future lease obligations in the amount of $12.3 million. The contract was determined to be an operating lease, whereby the Company is not required to make rent payments prior to the lease commencement date while construction is completed on the underlying asset. Due to the nature of the work and the amount of the Company’s contribution to the construction period costs for the lease, the Company was determined not to be the owner of the assets under construction as the landlord has substantially all of the construction period risks.
REDWIRE CORPORATION
NOTES TO CONSOLIDATED FINANCIAL STATEMENTS
(Tabular amounts in thousands of U.S. dollars, except percentages, unit, share, and warrant amounts)
Supplemental Balance Sheet Information
The following table presents supplemental balance sheet information related to the Company’s operating and finance leases:
| | | | | | | | | | | | | | | | | | | | | | | |
| December 31, 2025 | | December 31, 2024 |
| Operating Leases | | Finance Leases | | Operating Leases | | Finance Leases |
| Right-of-use assets, net reflected in the following balance sheet line items: | | | | | | | |
Property, plant and equipment, net | $ | — | | | $ | 1,786 | | | $ | — | | | $ | 1,392 | |
| Right-of-use assets | 31,741 | | | — | | | 15,277 | | | — | |
Total right-of-use assets | $ | 31,741 | | | $ | 1,786 | | | $ | 15,277 | | | $ | 1,392 | |
| | | | | | | |
| Current lease balance reflected in the following balance sheet line items: | | | | | | | |
| Short-term operating lease liabilities | $ | 4,088 | | | $ | — | | | $ | 4,354 | | | $ | — | |
| Short-term finance lease liabilities | — | | | 595 | | | — | | | 473 | |
| | | | | | | |
Non-current lease balance reflected in the following balance sheet line items: | | | | | | | |
| Long-term operating lease liabilities | 30,471 | | | — | | | 13,444 | | | — | |
| Long-term finance lease liabilities | — | | | 1,276 | | | — | | | 980 | |
| Total lease liabilities | $ | 34,559 | | | $ | 1,871 | | | $ | 17,798 | | | $ | 1,453 | |
Other Supplemental Information
The following table presents other supplemental information related to the Company’s leases:
| | | | | | | | | | | | | | | | | | | | | | | | | | | | | | | | | | |
| | | Year Ended |
| | | December 31, 2025 | | December 31, 2024 | December 31, 2023 |
| | | Operating Leases | | Finance Leases | | Operating Leases | | Finance Leases | Operating Leases | | Finance Leases |
| Cash paid for lease liabilities | | | $ | 8,543 | | | $ | 690 | | | $ | 2,460 | | | $ | 601 | | $ | 4,273 | | | $ | 492 | |
| ROU assets obtained in exchange for new lease liabilities | | | $ | 7,330 | | | $ | 774 | | | $ | 5,813 | | | $ | 457 | | $ | 3,418 | | | $ | 1,167 | |
| | | | | | | | | | | | |
| Weighted average remaining lease term (in years) | | | 5.4 | | 3.4 | | 4.0 | | 3.3 | 4.4 | | 3.8 |
| Weighted average discount rate | | | 8.9 | % | | 7.9 | % | | 7.8 | % | | 8.1 | % | 6.3 | % | | 8.4 | % |
Future Lease Obligations
As of December 31, 2025, the future annual minimum lease payments for lease liabilities are as follows:
| | | | | | | | | | | | | | |
| | | | |
| Year | | Operating Leases | | Finance Leases |
| 2026 | | $ | 7,052 | | | $ | 716 | |
| 2027 | | 8,120 | | | 624 | |
| 2028 | | 6,419 | | | 429 | |
| 2029 | | 5,265 | | | 237 | |
| 2030 | | 5,478 | | | 124 | |
Thereafter | | 16,872 | | | — | |
Total lease payments | | 49,206 | | | 2,130 | |
| Less: imputed interest | | 14,647 | | | 259 | |
Present value of lease liabilities | | $ | 34,559 | | | $ | 1,871 | |
| | | | |
Note K – Warrants and Capital Stock Transactions
Public Warrants
Each public warrant entitles the registered holder to purchase one share of common stock at a price of $11.50 per share, subject to
REDWIRE CORPORATION
NOTES TO CONSOLIDATED FINANCIAL STATEMENTS
(Tabular amounts in thousands of U.S. dollars, except percentages, unit, share, and warrant amounts)
adjustment. Pursuant to the warrant agreement, a warrant holder may exercise its warrants only for a whole number of shares of common stock. This means only a whole warrant may be exercised at a given time by a warrant holder. The warrants will expire on September 2, 2026, at 5:00 p.m., New York City time, or earlier upon redemption or liquidation.
The Company may call the public warrants for redemption as follows: (1) in whole and not in part; (2) at a price of $0.01 per warrant; (3) upon a minimum of 30 days prior written notice of redemption; and (4) only if the last reported closing price of the common stock equals or exceeds $18.00 per share for any 20 trading days within a 30-trading day period ending on the 3rd trading day prior to the date on which the Company sends the notice of redemption to the warrant holders.
If the Company calls the public warrants for redemption, management will have the option to require all holders that wish to exercise the public warrants to do so on a “cashless basis.”
The exercise price and number of shares of common stock issuable upon exercise of the warrants may be adjusted in certain circumstances including a consolidation, combination, reverse stock split or reclassification of shares of the Company’s common stock or other similar event. In no event will the Company be required to net cash settle the warrant shares.
On February 20, 2025, the Company directed its warrant agent to deliver a notice of redemption to each registered holder of the outstanding public warrants in accordance with the terms under the warrant agreement as further described above. During the year ended December 31, 2025, 6,738,225 public warrants were exercised and converted into 6,738,225 shares of Company’s common stock at the exercise price of $11.50 per share for proceeds of $77.5 million and 1,450,586 public warrants were redeemed by the Company at $0.01 per warrant.
As of December 31, 2025, there were no public warrants issued and outstanding and as of December 31, 2024, there were 8,188,811 public warrants issued and outstanding.
Private Warrants
The terms and provisions of the public warrants described above also apply to the private warrants. If the private warrants are held by holders other than the original holders or their respective permitted transferees, the private warrants will be redeemable by the Company and exercisable by the holders on the same basis as the public warrants. The original holders and their respective permitted transferees have the option to exercise the private warrants on a cashless basis.
During the year ended December 31, 2025, 4,631,799 private warrants were exercised on a cashless basis for 2,293,739 shares of the Company’s common stock. The conversion factor was derived by multiplying the amount of common shares underlying the warrants by the excess fair value over the warrant exercise price and then dividing by the fair value. The fair value is defined as the average closing price of the Company’s common stock for the ten (10) trading days ending on the third trading day prior to the date on which the notice of exercise was provided to the Company’s stock transfer agent. Additionally, during the year ended December 31, 2025, 467,174 private warrants were exercised and converted into 467,174 shares of the Company’s common stock at the exercise price of $11.50 per share for proceeds of $5.4 million. Upon exercise, the Company remeasured the fair value of the related warrants and released the associated liability upon issuance of the Company’s common stock. Refer to Note D – Fair Value of Financial Instruments for information on the Level 3 inputs used to value the private warrants.
As of December 31, 2025 and 2024, respectively, there were 2,633,195 and 7,732,168 private warrants issued and outstanding.
Equity Offering
In June 2025, the Company issued 15,525,000 shares of common stock at a price of $16.75 per share for net proceeds of $245.0 million (the “Equity Offering”). The shares were issued pursuant to the Company’s Form S-3 filed with the SEC on September 6, 2023, under which the Company may offer and sell up to $400 million of the Company’s securities. In connection with the issuance of common stock, the Company used a portion of the proceeds to repay the Seller Note in accordance with the terms of the agreement. Refer to Note I – Debt for additional information on the Seller Note. In July 2025, the Company issued an additional 600,100 shares of common stock pursuant to the underwriters’ over-allotment option at a price of $16.75 per share for additional net proceeds of $9.1 million.
ATM Facility
In November 2025, the Company entered into an Equity Distribution Agreement (the “ATM Agreement”) by and between the Company, Truist Securities, Inc., J.P. Morgan Securities LLC, BofA Securities, Inc. and TCBI Securities, Inc., doing business as Texas Capital Securities (each an “Agent” and collectively, the “Agents”). Pursuant to the terms of the ATM Agreement, the
REDWIRE CORPORATION
NOTES TO CONSOLIDATED FINANCIAL STATEMENTS
(Tabular amounts in thousands of U.S. dollars, except percentages, unit, share, and warrant amounts)
Company may sell, from time to time through or to the Agents, as the Company’s sales agent and/or as principal, shares of its common stock (the “Shares”), having an aggregate gross sales price of up to $250 million. The sales, if any, of the Company’s common stock made under the ATM Agreement may be made in sales deemed to be “at-the-market offerings” as defined in Rule 415 under the Securities Act of 1933, as amended, including sales made directly on the New York Stock Exchange, on any other existing trading market for the Shares, or to or through a market maker other than on an exchange. The Company incurred costs associated with the ATM Agreement of $0.7 million, which were recorded to APIC against proceeds received from sales of the Company’s common stock under the ATM Agreement.
As of December 31, 2025, the Company had sold 25,520,441 shares of its common stock at a weighted average price of $7.23 for $184.6 million of gross proceeds. The Company also incurred $4.6 million of commission fees resulting in $180.0 million net proceeds. The Company had $65.4 million of unused capacity under the ATM agreement as of December 31, 2025.
Note L – Income Taxes
Income (loss) before income taxes consisted of the following:
| | | | | | | | | | | | | |
| Year Ended |
| December 31, 2025 | December 31, 2024 | December 31, 2023 | | |
Domestic income (loss) | $ | (190,676) | | $ | (108,886) | | $ | (20,310) | | | |
Foreign income (loss) | (60,890) | | (7,445) | | (7,440) | | | |
Income (loss) before income taxes | $ | (251,566) | | $ | (116,331) | | $ | (27,750) | | | |
Income tax provision (benefit) consisted of the following:
| | | | | | | | | | | | | | | | | | | | | | |
| | | | | | | | |
| | | | | Year Ended |
| | | | | December 31, 2025 | | December 31, 2024 | | | December 31, 2023 |
| Current: | | | | | | | | | | |
| Federal | | | | | $ | (64) | | | $ | — | | | | $ | — | |
| State | | | | | (5) | | | 67 | | | | (73) | |
| Foreign | | | | | (44) | | | (284) | | | | 512 | |
| Total current income tax expense (benefit) | | | | | (113) | | | (217) | | | | 439 | |
| | | | | | | | | | |
| Deferred: | | | | | | | | | | |
| Federal | | | | | (19,423) | | | (122) | | | | 48 | |
| State | | | | | (5,135) | | | 271 | | | | 62 | |
| Foreign | | | | | (343) | | | (1,952) | | | | (1,035) | |
| Total deferred income tax expense (benefit) | | | | | (24,901) | | | (1,803) | | | | (925) | |
| | | | | | | | | | |
| Total income tax expense (benefit) | | | | | $ | (25,014) | | | $ | (2,020) | | | | $ | (486) | |
A reconciliation of the U.S. federal statutory income tax expense to actual income tax expense is as follows:
REDWIRE CORPORATION
NOTES TO CONSOLIDATED FINANCIAL STATEMENTS
(Tabular amounts in thousands of U.S. dollars, except percentages, unit, share, and warrant amounts)
| | | | | | | | | | | | | | | | |
| | | | | | | | |
| | | | | | | | | | |
| | | | | Year Ended |
| | | | | December 31, 2025 | | | | |
| | | | | Amount | Rate | | | | |
| Income (loss) before income taxes | | | | | $ | (251,566) | | | | | | |
| Federal statutory income tax rate | | | | | 21.0 | % | | | | | |
| Expected federal provision (benefit) for income taxes at the federal statutory income tax rate | | | | | (52,829) | | 21.0 | % | | | | |
| State and local income taxes, net of federal income tax effect* | | | | | (6,685) | | 2.7 | % | | | | |
| Foreign tax effects: | | | | | | | | | | |
| Belgium: | | | | | | | | | | |
| Impairment of goodwill | | | | | 5,175 | | (2.1) | % | | | | |
Statutory tax rate difference | | | | | (2,172) | | 0.9 | % | | | | |
| Changes in valuation allowance | | | | | 8,450 | | (3.4) | % | | | | |
| Other | | | | | (33) | | — | % | | | | |
Other foreign jurisdictions: | | | | | | | | | | |
Statutory tax rate difference | | | | | 59 | | — | % | | | | |
| | | | | | | | | | |
| | | | | | | | | | |
Change in valuation allowance | | | | | 481 | | (0.2) | % | | | | |
| Other | | | | | 438 | | (0.2) | % | | | | |
Nontaxable or nondeductible items: | | | | | | | | | | |
| Change in fair value of warrants | | | | | (3,383) | | 1.3 | % | | | | |
| Tax (benefits) / non-deductible expenses related to equity-based compensation | | | | | (4,371) | | 1.7 | % | | | | |
Acquisitions costs | | | | | 2,377 | | (0.9) | % | | | | |
| Non-deductible compensation costs related to the Edge Incentive Units | | | | | 9,224 | | (3.7) | % | | | | |
Effect of cross-border tax laws: | | | | | | | | | | |
| Global intangible low-taxed income | | | | | 1,156 | | (0.5) | % | | | | |
Change in valuation allowance | | | | | 16,449 | | (6.5) | % | | | | |
| Other | | | | | 650 | | (0.3) | % | | | | |
| Total income tax expense (benefit) | | | | | $ | (25,014) | | 9.9 | % | | | | |
| | | | | | | | | | |
| Effective tax rate | | | | | 9.9 | % | | | | | |
*State taxes in California make up the majority (greater than 50%) of the tax effect in this category for the year ended December 31, 2025.
REDWIRE CORPORATION
NOTES TO CONSOLIDATED FINANCIAL STATEMENTS
(Tabular amounts in thousands of U.S. dollars, except percentages, unit, share, and warrant amounts)
A reconciliation of the U.S. federal statutory income tax expense to actual income tax expense is as follows:
| | | | | | | | | | | | | | | | | | | | | | | | |
| | | | | | | | | |
| | | | | | | | | | |
| | | | | Year Ended |
| | | | | | December 31, 2024 | | December 31, 2023 |
| | | | | | Amount | Rate | | Amount | Rate |
| Income (loss) before income taxes | | | | | | $ | (116,331) | | | | $ | (27,750) | | |
| Federal statutory income tax rate | | | | | | 21.0 | % | | | 21.0 | % | |
| Expected federal provision (benefit) for income taxes at the federal statutory income tax rate | | | | | | (24,430) | | 21.0 | % | | (5,828) | | 21.0 | % |
| State income tax (benefit), net of federal tax benefit | | | | | | (3,159) | | 2.7 | % | | (1,190) | | 4.3 | % |
| Change in fair value of warrants | | | | | | 10,912 | | (9.4) | % | | 422 | | (1.5) | % |
| | | | | | | | | | |
| | | | | | | | | | |
| Permanent differences | | | | | | 314 | | (0.3) | % | | 136 | | (0.5) | % |
| Tax (benefits) / non-deductible expenses related to equity-based compensation | | | | | | (636) | | 0.5 | % | | 984 | | (3.5) | % |
| Acquisition costs | | | | | | 219 | | (0.2) | % | | — | | — | % |
| | | | | | | | | | |
| Change in valuation allowance | | | | | | 16,153 | | (13.9) | % | | 4,808 | | (17.3) | % |
| Other | | | | | | (1,393) | | 1.2 | % | | 182 | | (0.7) | % |
| Total income tax expense (benefit) | | | | | | $ | (2,020) | | 1.7 | % | | $ | (486) | | 1.8 | % |
| | | | | | | | | | |
| Effective tax rate | | | | | | 1.7 | % | | | 1.8 | % | |
The table below presents the components of deferred tax assets, net and deferred tax liabilities:
| | | | | | | | | | | |
| December 31, 2025 | | December 31, 2024 |
| Deferred tax assets: | | | |
| Accrued expenses and reserves | $ | 7,287 | | | $ | 456 | |
| Capitalized research and development expenses | 8,722 | | | 4,528 | |
| | | |
| Tax credit carryforwards | 618 | | | 243 | |
| Deferred revenue | 3,652 | | | 1,367 | |
| Net operating loss carryforwards | 80,436 | | | 38,676 | |
| Interest disallowance | 18,164 | | | 10,007 | |
| Equity-based compensation | 4,430 | | | 2,643 | |
| Lease liability | 9,183 | | | 4,956 | |
| Other assets | 50 | | | 62 | |
| Total deferred tax assets | 132,542 | | | 62,938 | |
| Less: valuation allowance | (70,704) | | | (45,324) | |
| Deferred tax assets, net of valuation allowance | 61,838 | | | 17,614 | |
| | | |
| Deferred tax liabilities: | | | |
| Right-of-use asset | $ | (8,425) | | | $ | (4,291) | |
Tax on undistributed profits | (8,741) | | | — | |
| Depreciation and amortization | (79,471) | | | (13,616) | |
| Other | (3,559) | | | (217) | |
| Deferred tax liabilities | (100,196) | | | (18,124) | |
| Total net deferred tax assets (liabilities) | $ | (38,358) | | | $ | (510) | |
In assessing the realizability of deferred tax assets, the Company evaluates whether it is more-likely-than-not that a portion or all of the deferred tax assets will not be realized. The ultimate realization of the deferred tax assets is dependent upon the generation of future taxable income during the periods in which the net operating loss (“NOL”) carryforwards are available. During the year ended December 31, 2025, and in connection with the acquisition of Edge Autonomy, the Company determined that a portion of its deferred tax assets would, more-likely-than-not, be realized and, as a result, the Company recognized a tax benefit of $25.0 million,
REDWIRE CORPORATION
NOTES TO CONSOLIDATED FINANCIAL STATEMENTS
(Tabular amounts in thousands of U.S. dollars, except percentages, unit, share, and warrant amounts)
substantially all of which relates to the recognition of deferred tax assets and the corresponding reduction of the valuation allowance.
The table below presents the change in valuation allowance for the following periods:
| | | | | |
| |
| |
| |
| |
| |
| Valuation allowance as of December 31, 2023 | $ | (23,821) | |
| Acquired deferred tax assets | (5,350) | |
Income tax expense | (16,153) | |
| Valuation allowance as of December 31, 2024 | (45,324) | |
| Income tax expense | (25,380) | |
| Valuation allowance as of December 31, 2025 | $ | (70,704) | |
As of December 31, 2025, the Company had $80.4 million of total net operating losses (“NOL”) resulting in deferred taxes assets consisting of U.S. federal, state (net), and foreign NOLs of $54.1 million, $16.1 million, and $10.2 million, respectively. The $54.1 million in U.S. federal net operating loss carryforwards may be carried forward indefinitely to reduce future taxable income for U.S. federal tax purposes, while certain state and foreign net operating loss carryforwards will begin to expire in 2039.
The table below presents changes in reserves for unrecognized income tax benefits for the following periods:
| | | | | | | | | | | | | | | | | | |
| | | | |
| Year Ended |
| December 31, 2025 | | December 31, 2024 | | | December 31, 2023 |
| Unrecognized tax benefits, beginning of period | $ | 1,380 | | | $ | 1,380 | | | | $ | 1,380 | |
| Increase (decrease) for tax positions taken related to a prior period | — | | | — | | | | — | |
| | | | | | |
| Unrecognized tax benefits, end of period | $ | 1,380 | | | $ | 1,380 | | | | $ | 1,380 | |
During the years ended December 31, 2025, 2024 and 2023, the Company did not recognize certain tax benefits from uncertain tax positions within the provision for income taxes. As of December 31, 2025, the Company’s estimated gross unrecognized tax benefits were $1.4 million, of which $1.3 million, if recognized, would favorably impact the Company’s future earnings. The Company believes there will be no material changes to unrecognized tax benefits within the next twelve months. Due to uncertainties in any tax audit outcome, estimates of the ultimate settlement of our unrecognized tax positions may change and the actual tax benefits may differ from the estimates. During the years ended December 31, 2025, 2024 and 2023, the Company did not recognize any interest and penalties in the consolidated statements of operations and comprehensive income (loss).
The Company and its subsidiaries file income tax returns in various U.S. and foreign jurisdictions. As of December 31, 2025, the Company is subject to examination by the IRS for tax years beginning in 2022. The Company is open to state income tax examinations until the applicable statute of limitations expires, generally four years after tax return filing; however, the ability for the taxing authority to adjust tax attribute carryforwards will continue until the applicable statute of limitations expires after tax attribute utilization or expiration.
Note M – Commitments and Contingencies
Contingencies in the Normal Course of Business
Under certain contracts with the U.S. government and certain governmental entities, contract costs, including indirect costs, are subject to audit by and adjustment through negotiation with governmental representatives. Revenue is recorded in amounts expected to be realized on final settlement of any such audits.
Legal Proceedings
The Company is subject to litigation, claims, investigations and audits arising from time to time in the ordinary course of business. Although legal proceedings are inherently unpredictable, the Company believes it has valid defenses with respect to any matters currently pending against it and intends to defend itself vigorously. Excluding pending matters disclosed below, the outcome of these matters, individually and in the aggregate, is not expected to have a material impact on the Company’s consolidated financial statements. The Company has established reserves for matters for which the Company believes that losses are probable and can be reasonably estimated. For matters, including certain of those described herein, where the Company has not established a reserve, the ultimate outcome or resolution cannot be predicted at this time, or the amount of ultimate loss, if any, cannot be reasonably estimated. These matters are subject to many uncertainties and the outcome of the individual claims is not predictable with certainty. It is possible
REDWIRE CORPORATION
NOTES TO CONSOLIDATED FINANCIAL STATEMENTS
(Tabular amounts in thousands of U.S. dollars, except percentages, unit, share, and warrant amounts)
that certain of the actions, claims, inquiries or proceedings, including those discussed herein, could be decided unfavorably to the Company or any of its subsidiaries involved. Accordingly, it is possible that an adverse outcome from such a proceeding could exceed the amount accrued in an amount that could be material to the accompanying consolidated financial position, results of operations or cash flows in any particular reporting period. The Company recognizes legal expenses when incurred, unless otherwise disclosed below, as selling, general and administrative expense in the consolidated statements of operations and comprehensive income (loss).
On December 17, 2021, the Company, our Chairman and Chief Executive Officer, Peter Cannito, and then current, but now former Chief Financial Officer, William Read, were named as defendants in a putative class action complaint filed in the United States District Court for the Middle District of Florida. That litigation is captioned Lemen v. Redwire Corp. et al., Case No. 3:21-cv-01254-TJC-PDB (M.D. Fla.) (“Lemen”). On March 7, 2022, the Court appointed a lead plaintiff. On June 17, 2022, the lead plaintiff filed an amended complaint. In the amended complaint, the lead plaintiff alleges that the Company and certain of its directors and officers made misleading statements and/or failed to disclose material facts about the Company’s business, operations, and prospects, allegedly in violation of Section 10(b) (and Rule 10b-5 promulgated thereunder) and Section 20(a) of the Exchange Act. As relief, the plaintiffs are seeking, among other things, compensatory damages. On August 16, 2022, the defendants moved to dismiss the complaint in its entirety, and such motion was denied by the Court on March 22, 2023. On November 15, 2024, the Company and plaintiffs filed a joint motion for a stipulated order to settle this litigation pursuant to a settlement agreement entered into among the parties. Under the terms of the agreement, Redwire agreed to pay $8.0 million to settle claims brought on behalf of purchasers of Redwire’s publicly traded shares from March 25, 2021, through March 31, 2022. Redwire has agreed to certification of a settlement class to facilitate resolution of claims. The Company consistently denied the accusations and entered into this proposed settlement, which was not an admission or concession of liability, to avoid the costs and risks inherent in continued litigation. During the year ended December 31, 2025, the Company paid the $8.0 million settlement amount into escrow releasing the previously recognized loss contingency. That amount was later released from escrow following a final order by the Court approving the settlement and dismissing the case with prejudice, which was entered on August 18, 2025. The Company anticipates recovery from insurance of approximately $1.1 million of the settlement amount, most of which has now been recovered by the Company. The remainder of the anticipated recovery is included as prepaid expenses and other current assets in the consolidated balance sheets. The settlement has resolved all claims against Redwire and the other defendants in this matter.
On May 25, 2022, a plaintiff commenced derivative litigation in the United States District Court for the District of Delaware on behalf of the Company against Peter Cannito, Les Daniels, Reggie Brothers, Joanne Isham, Kirk Konert, Jonathan Baliff, and John S. Bolton. That litigation is captioned Yingling v. Cannito, et al., Case No. 1:22-cv-00684-MN (D. Del.). The complaint’s allegations are similar to those of a previously settled class action lawsuit filed in December 2021 (Lemen), namely, that statements about the Company’s business and operations were misleading due to alleged material weaknesses in the Company’s financial reporting internal controls. The plaintiff alleges the defendants violated Section 10(b) (and Rule 10b-5 promulgated thereunder) and Section 20(a) of the Exchange Act, breached their fiduciary duty by allowing misleading disclosures to be made, and caused the Company to overpay compensation and bonuses tied to the Company’s financial performance. As relief, the plaintiffs are seeking, among other things, compensatory and punitive damages. This litigation had previously been stayed pending resolution of the Lemen matter. Subsequent to the announcement of the Lemen settlement, the parties entered into a stipulated transfer of this matter to the United States District Court for the Middle District of Florida to be handled by the same judge overseeing the Lemen litigation. Shortly after this transfer of venue, the Court entered an administrative stay of the matter pending final resolution of the Lemen matter. In light of the final settlement of the Lemen matter during August 2025, the stay was lifted, and discovery in this matter has resumed. The defendants maintain that the allegations are without merit. On August 14, 2025, the Company and the individual defendants reached an agreement-in-principle with plaintiff to settle this matter, whereby the Company would adopt certain corporate governance reforms, subject to Court approval of a final settlement agreement. After negotiating these reforms, counsel for plaintiff and counsel for the Company and individual defendants separately, and through mediation, negotiated the attorneys’ fees and expenses to be paid to plaintiff’s counsel in the amount of $0.9 million, subject to Court approval. If the settlement is not approved, discovery is expected to resume, and the Company is currently unable to predict the likely outcome of the proceedings or estimate the range of reasonably possible losses, which may be material. The Company has recognized a loss contingency of $0.9 million and a corresponding $0.9 million anticipated insurance recovery as of December 31, 2025, which is its best estimate of probable loss and recovery based on the current circumstances. The loss contingency and anticipated recovery is included as other current liabilities and prepaid expenses and other current assets in the consolidated balance sheets, respectively.
Business Combinations
The Company has acquired and plans to continue to acquire businesses with prior operating histories. These acquisitions may have unknown or contingent liabilities, which the Company may become responsible for and could have a material impact on the Company’s future operating results and cash flows. In addition, the Company may incur acquisition costs, regardless of whether or not the acquisition is ultimately completed, which may be material to future periods. Refer to Note C – Business Combinations for additional information.
REDWIRE CORPORATION
NOTES TO CONSOLIDATED FINANCIAL STATEMENTS
(Tabular amounts in thousands of U.S. dollars, except percentages, unit, share, and warrant amounts)
Letters of Credit
The Company enters into letters of credit from time to time issued on its behalf by financial institutions secured by restricted cash. Letters of credit generally are available for draw down in the event the Company does not fulfill its contractual obligations. The Company had outstanding letters of credit of $0.7 million and $15.4 million as of December 31, 2025 and 2024, respectively.
Note N – Convertible Preferred Stock
The table below presents activity of the Company’s Series A Convertible Preferred Stock:
| | | | | | | | | | | |
| Shares | | Amount |
| | | |
| | | |
| | | |
| | | |
| | | |
| | | |
| | | |
Balance as of December 31, 2023 | 93,890.20 | | | $ | 96,106 | |
Dividends paid-in-kind | 14,759.10 | | | 40,699 | |
| | | |
| | | |
Balance as of December 31, 2024 | 108,649.30 | | | $ | 136,805 | |
Dividends paid-in-kind | 11,379.79 | | | 47,146 | |
Conversion into common stock | (61,895.39) | | | (90,158) | |
| Repurchase of convertible preferred stock | (11,628.57) | | | (16,759) | |
Balance as of December 31, 2025 | 46,505.13 | | | $ | 77,034 | |
| | | |
On October 28, 2022, the Company filed a Certificate of Designation describing the terms and conditions of newly issued Series A Convertible Preferred Stock of the Company, par value $0.0001 (the “Convertible Preferred Stock”), with 88,000.00 total shares constituting the series. On or around the same date, the Company entered into investment agreements with (i) AE Fund II and AE Industrial Partners Structured Solutions I, LP (“AEI Structured Solutions”, and together with AEI Fund II, (“AEI”)), (ii) BCC Redwire Aggregator, LP (“Bain Capital”) and (iii) various investors (collectively, the “Additional Investors,” and together with AEI and Bain Capital, the “Investors”). Pursuant to the investment agreements, the Company sold an aggregate of 81,250.00 shares (“Purchased Shares”) of Convertible Preferred Stock for an aggregate purchase price of $81.25 million, or $76.4 million net of issuance costs. The investment agreements contain customary representations, warranties and covenants of the Company and Investors. On October 31, 2023, the Company filed a Certificate of Amendment of Certificate of Designation of the Company, which was filed solely to increase the amount of shares designated as Convertible Preferred Stock, par value $0.0001 per share, to 125,292.00.
Based on an evaluation of the investment agreements, the Company determined that the Convertible Preferred Stock is contingently or optionally redeemable and, therefore, does not require liability classification. However, due to the Convertible Preferred Stock being redeemable at the option of the holder or upon a fundamental change, which includes events that are not fully within the Company’s control, it was determined that the Convertible Preferred Stock should be classified as one line item in temporary (mezzanine) equity on the Company’s consolidated balance sheets.
During May and November 2025, in accordance with the Convertible Preferred Stock Certificate of Designation, the Company issued 8,068.27 and 3,311.52 shares, respectively, of Convertible Preferred Stock to holders of record as of April 15, 2025 and October 15, 2025, respectively, as a PIK Dividend on the Convertible Preferred Stock. As the Company has the option of paying dividends on the Convertible Preferred Stock in either cash or in kind, the PIK Dividend is recorded at fair value as of the respective declaration date. The fair value of the PIK Dividend as of April 15, 2025 and October 15, 2025 was $33.3 million and $13.9 million, respectively, which was recorded against additional paid-in-capital since the Company has an accumulated loss. The fair value of the May and November 2025 PIK Dividends was calculated using the accrued value per share after a remaining term of 1.0 year and 2.0 years, respectively, on an as-converted basis, or $4,125 per share and $4,186 per share, respectively.
During the year ended December 31, 2025, 61,895.39 shares of the Company’s Convertible Preferred Stock were, at the option of the holder in accordance with the Convertible Preferred Stock Certificate of Designation, converted into 21,529,115 shares of the Company’s common stock, respectively, based on the accrued value (defined as the initial value plus accumulated paid and unpaid dividends) as of the conversion date and a conversion ratio of $3.05.
Additionally, during the year ended December 31, 2025, the Company used a portion of the proceeds from its common stock issuance to repurchase 11,628.57 shares of Convertible Preferred Stock, respectively, from Bain Capital for $63.9 million in accordance with the Registration Rights Coordination Agreement, dated as of June 8, 2025, by and between the Company, Bain Capital, and AEI. As a result, during the year ended December 31, 2025, $16.8 million was derecognized from temporary (mezzanine) equity, which represented the net book value of the Convertible Preferred Stock as of the repurchase date and $47.1 million was recorded against accumulated deficit as a distribution.
REDWIRE CORPORATION
NOTES TO CONSOLIDATED FINANCIAL STATEMENTS
(Tabular amounts in thousands of U.S. dollars, except percentages, unit, share, and warrant amounts)
Bain Capital Director and Nominees
For so long as Bain Capital held record and beneficial ownership of at least 50% of the Purchased Shares issued to it as of November 3, 2022, Bain Capital would have the right to designate one member to the Company’s Board of Directors (the “Board”). During the year ended December 31, 2025, Bain Capital, at its option, converted all of their remaining 60,228.77 shares of its Convertible Preferred Stock into 20,962,691 shares of the Company’s common stock and subsequently sold such shares of common stock. As such, Bain Capital no longer holds shares of the Company’s common stock or Convertible Preferred Stock.
Convertible Preferred Stock Features
No holder of Convertible Preferred Stock was permitted to transfer any of their shares to any unaffiliated person for twelve (12) months following the closing date of the applicable investment agreement, except for certain exceptions, including that Bain Capital and AEI were permitted to transfer shares to each other. AEI has been provided customary preemptive rights with respect to the Convertible Preferred Stock and, after the seventh anniversary of the closing date, for so long as AEI has record and beneficial ownership of at least 50% of the Purchased Shares initially issued to them, may cause the Company to retain an investment banker to identify and conduct a potential sale of the Company.
The Convertible Preferred Stock is convertible into shares of common stock at an initial conversion price of $3.05 per share, subject to customary anti-dilution and price protective adjustments.
The Company previously obtained the requisite shareholder approval for the conversion of the Convertible Preferred Stock into common stock above the 19.99% Limitation (as defined below). On June 20, 2023, the Company filed with the SEC a Schedule 14C information statement pursuant to Section 14(c) of the Exchange Act, which provided notice of the approval of (i) the conversion of the Convertible Preferred Stock into shares of common stock in excess of 19.99% of the 63,852,690 shares outstanding as of October 28, 2022 immediately after giving effect to such conversion (the “Conversion Cap”) and (ii) voting rights of the aggregate number of votes to which all holders of outstanding shares of Convertible Preferred Stock are entitled to vote in excess of 19.99% of the aggregate number of votes to which all shareholders of the Company were entitled to vote as of October 28, 2022 (including the holders of shares of Preferred Stock) (the “Voting Cap” and, together with the Conversion Cap, the “19.99% Limitation”).
As of December 31, 2025, the 46,505.13 outstanding shares of Convertible Preferred Stock were convertible into approximately 15,583,454 shares of the Company’s common stock. The holders of Convertible Preferred Stock are entitled to vote with the holders of common stock, on an as-converted basis. In addition, holders of Convertible Preferred Stock have the right, at their option and at any time, to convert their shares into shares of common stock. Each share of Convertible Preferred Stock will mandatorily convert upon achieving thresholds related to the Company’s market capitalization and profitability metrics and the Company is required to make an offer to repurchase the outstanding Convertible Preferred Stock upon a fundamental change.
Dividends on the Convertible Preferred Stock can be paid in either cash or in kind in the form of additional shares of Convertible Preferred Stock, at the option of the Company, subject to certain exceptions. If paid in cash, such dividends will be paid at a rate of 13% per annum, subject to certain adjustments and exceptions or, if the Company issues PIK dividends, at a rate of 15% per annum, subject to certain adjustments and exceptions. Each holder of Convertible Preferred Stock has been given certain registration rights pursuant to the Registration Rights Agreement, dated October 28, 2022. As of December 31, 2025, the accumulated but not declared or paid dividends on the Convertible Preferred Stock were $1.0 million.
Liquidation Preference
The Convertible Preferred Stock ranks senior to the Company’s common stock. In the event of any liquidation or winding up of the Company, the holders of the Convertible Preferred Stock shall be entitled to receive in preference to the holders of the Company’s common stock the greater of (a) the greater of (i) two times the Initial Value (defined as $1,000 per share) and (ii) the Initial Value plus accrued and unpaid dividends, whether or not declared, and (b) the amount that would have been received based on the if-converted Accrued Value, defined as Initial Value plus accrued and unpaid dividends, whether or not declared. As of December 31, 2025 and 2024, the liquidation preference of the Convertible Preferred Stock was $118.4 million and $599.4 million, respectively.
Note O – Shareholders’ Equity
On September 2, 2021, the Company approved the authorization to issue up to 500,000,000 shares of common stock at a $0.0001 par value per share and 100,000,000 shares of preferred stock at a $0.0001 par value per share.
ATM Facility
During November 2025, the Company entered into the ATM Agreement and pursuant to the ATM Agreement, the Company has the
REDWIRE CORPORATION
NOTES TO CONSOLIDATED FINANCIAL STATEMENTS
(Tabular amounts in thousands of U.S. dollars, except percentages, unit, share, and warrant amounts)
right, but not the obligation, to direct the Agents to purchase shares of the Company’s common stock up to an aggregate gross sales price of up to $250 million. Refer to Note K – Warrants and Capital Stock Transactions for more information.
Common Stock
The Company had 191,915,804 and 67,002,370 shares of common stock outstanding as of December 31, 2025 and 2024, respectively.
Dividend Rights
Subject to applicable law and the rights, if any, of the holders of any outstanding series of the Company’s preferred stock or any class or series of stock having a preference over or the right to participate with the Company’s common stock with respect to the payment of dividends, dividends may be declared and paid ratably on the Company’s common stock out of the assets of the Corporation that are legally available for this purpose at such times and in such amounts as the Company’s Board in its discretion shall determine.
Voting Rights
Each outstanding share of the Company’s common stock is entitled to one vote on all matters submitted to a vote of shareholders. Holders of shares of common stock do not have cumulative voting rights.
Conversion or Redemption Rights
The Company’s common stock is neither convertible nor redeemable.
Liquidation Rights
Upon the Company’s liquidation, the holders of the Company’s common stock are entitled to receive pro-rata the Company’s assets that are legally available for distribution, after payment of all debts and other liabilities and subject to the prior rights of any holders of the Company’s preferred stock then outstanding.
Preferred Stock
The Company had no shares of preferred stock outstanding as of December 31, 2025 and 2024, respectively.
The Company’s Board may, without further action by the Company’s shareholders, from time to time, direct the issuance of shares of preferred stock in series and may, at the time of issuance, determine the designations, powers, preferences, privileges and relative participating, optional or special rights as well as the qualifications, limitations or restrictions thereof, including dividend rights, conversion rights, voting rights, terms of redemption and liquidation preferences, any or all of which may be greater than the rights of the Company’s common stock. Satisfaction of any dividend preferences of outstanding shares of the Company’s preferred stock would reduce the amount of funds available for the payment of dividends on shares of the Company’s common stock. Upon the affirmative vote of a majority of the total number of directors then in office, the Company’s Board may issue shares of the Company’s preferred stock with voting and conversion rights which could adversely affect the holders of shares of the Company’s common stock. Please refer to Note N – Convertible Preferred Stock for further information on the Company’s Convertible Preferred Stock.
REDWIRE CORPORATION
NOTES TO CONSOLIDATED FINANCIAL STATEMENTS
(Tabular amounts in thousands of U.S. dollars, except percentages, unit, share, and warrant amounts)
Note P – Revenues
The following table presents the disaggregation of revenue according to segment:
| | | | | | | | | | | | | | | | | |
| Year Ended December 31, 2025 |
| Space | | Defense Tech | | Total |
Revenue percentage by recognition method | | | | | |
Over time | 97 | % | | 15 | % | | 66 | % |
Point in time | 3 | | | 85 | | | 34 | |
Total revenues | 100 | % | | 100 | % | | 100 | % |
Revenues by customer grouping | | | | | |
Civil space | $ | 69,453 | | | $ | 3,096 | | | $ | 72,549 | |
National security | 51,869 | | | 105,370 | | | 157,239 | |
Commercial and other | 88,495 | | | 17,098 | | | 105,593 | |
Total revenues | $ | 209,817 | | | $ | 125,564 | | | $ | 335,381 | |
Revenues by customer’s geographic location | | | | | |
U.S. | $ | 105,228 | | | $ | 90,716 | | | $ | 195,944 | |
| Europe | 104,574 | | | 20,742 | | | 125,316 | |
| Other | 15 | | | 14,106 | | | 14,121 | |
Total revenues | $ | 209,817 | | | $ | 125,564 | | | $ | 335,381 | |
REDWIRE CORPORATION
NOTES TO CONSOLIDATED FINANCIAL STATEMENTS
(Tabular amounts in thousands of U.S. dollars, except percentages, unit, share, and warrant amounts)
| | | | | | | | | | | | | | | | | |
| Year Ended December 31, 2024 |
| Space | | Defense Tech | | Total |
Revenues percentage by recognition method | | | | | |
Over time | 98 | % | | 100 | % | | 98 | % |
| Point in time | 2 | | | — | | | 2 | |
Total revenues | 100 | % | | 100 | % | | 100 | % |
Revenues by customer grouping | | | | | |
Civil space | $ | 84,923 | | | $ | 3,891 | | | $ | 88,814 | |
National security | 36,420 | | | 40,411 | | | 76,831 | |
Commercial and other | 133,993 | | | 4,463 | | | 138,456 | |
Total revenues | $ | 255,336 | | | $ | 48,765 | | | $ | 304,101 | |
Revenues by customer’s geographic location | | | | | |
U.S. | $ | 101,504 | | | $ | 48,627 | | | $ | 150,131 | |
| Europe | 153,747 | | | 12 | | | 153,759 | |
| Other | 85 | | | 126 | | | 211 | |
Total revenues | $ | 255,336 | | | $ | 48,765 | | | $ | 304,101 | |
| | | | | | | | | | | | | | | | | |
| Year Ended December 31, 2023 |
| Space | | Defense Tech | | Total |
Revenues percentage by recognition method | | | | | |
Over time | 94 | % | | 98 | % | | 95 | % |
| Point in time | 6 | | | 2 | | | 5 | |
Total revenues | 100 | % | | 100 | % | | 100 | % |
Revenues by customer grouping | | | | | |
Civil space | $ | 94,200 | | | $ | 8,394 | | | $ | 102,594 | |
National security | 26,456 | | | 32,597 | | | 59,053 | |
Commercial and other | 73,344 | | | 8,809 | | | 82,153 | |
Total revenues | $ | 194,000 | | | $ | 49,800 | | | $ | 243,800 | |
Revenues by customer’s geographic location | | | | | |
U.S. | $ | 124,846 | | | $ | 48,057 | | | $ | 172,903 | |
| Europe | 69,071 | | | 1,743 | | | 70,814 | |
| Other | 83 | | | — | | | 83 | |
Total revenues | $ | 194,000 | | | $ | 49,800 | | | $ | 243,800 | |
Customers comprising 10% or more of revenues are presented below for the following periods:
| | | | | | | | | | | | | | | | | | | | | | | | |
| | | | | | | | | | |
| | | Year Ended | | | |
| | | | | | December 31, 2025 | | December 31, 2024 | | December 31, 2023 | | | |
Customer A(1) | | | | | $ | — | | | $ | 31,055 | | | $ | 39,314 | | | | |
Customer B(1) | | | | | — | | | — | | | 33,621 | | | | |
| | | | | | | | | | | | |
Customer D(1) | | | | | 66,261 | | | 107,605 | | | — | | | | |
Customer E(1) | | | | | 62,829 | | | — | | | — | | | | |
| | | | | | | | | | | | |
| | | | | | | | | | | | |
(1) While revenue may have been generated during each of the periods presented, amounts are only disclosed for the periods in which revenues represented 10% or more of total revenue.
REDWIRE CORPORATION
NOTES TO CONSOLIDATED FINANCIAL STATEMENTS
(Tabular amounts in thousands of U.S. dollars, except percentages, unit, share, and warrant amounts)
Contract Balances
The table below presents the contract assets and contract liabilities included on the consolidated balance sheets for the following periods:
| | | | | | | | | | | | | |
| | | |
| December 31, 2025 | | December 31, 2024 | | |
Contract assets | $ | 44,019 | | | $ | 43,044 | | | |
| | | | | |
| Contract liabilities | $ | 60,119 | | | $ | 67,201 | | | |
The increase in contract assets during 2025 was primarily driven by production incurred on related contracts resulting in revenue recognized and the timing of billable milestones occurring during the year ended December 31, 2025.
The decrease in contract liabilities during 2025 was primarily driven by the timing of large billable milestones occurring during the last quarter of 2024 compared to the year ended December 31, 2025, as well as decreased bookings during 2025. Revenue recognized in the year ended December 31, 2025 that was included in the contract liability balance as of December 31, 2024 was $61.5 million. Revenue recognized in the year ended December 31, 2024 that was included in the contract liability balance as of December 31, 2023 was $49.4 million.
For revenue recognized over time, the Company evaluates the contract value and cost estimates at completion (“EAC”) for performance obligations at least quarterly and more frequently when circumstances significantly change. Due to the nature of the work required to be performed on many of the Company’s performance obligations, the estimate of total revenue and cost at completion is complex, subject to many variables and requires significant judgment by management on a contract-by-contract basis. As part of this process, management reviews information including, but not limited to, labor productivity, the nature and technical complexity of the work to be performed, availability and cost volatility of materials, subcontractor and vendor performance, volume assumptions, inflationary trends, and schedule and performance delays.
When the Company’s estimate of total costs to be incurred to satisfy a performance obligation exceeds the expected revenue, the Company recognizes the loss immediately by recording a loss reserve which is included in other current liabilities on the consolidated balance sheets. When the Company determines that a change in estimate has an impact on the associated profit of a performance obligation, the Company records the cumulative positive or negative adjustment in the consolidated statement of operations and comprehensive income (loss). Changes in estimates and assumptions related to the status of certain long-term contracts may have a material effect on the Company’s operating results.
Net EAC adjustments can have a significant effect on reported revenues and gross profit. The below table summarizes the favorable (unfavorable) impact on gross profit from the net EAC adjustments for the following periods:
| | | | | | | | | | | | | | | | | | | | | |
| | | | | | | |
| | | Year Ended |
| | | | | | December 31, 2025 | | December 31, 2024 | | December 31, 2023 |
| Net EAC adjustments, before income taxes | | | | | $ | (54,453) | | | $ | (17,696) | | | $ | (3,522) | |
| Net EAC adjustments, net of income taxes | | | | | (49,062) | | | (17,395) | | | (3,459) | |
| Net EAC adjustments, net of income taxes, per diluted share | | | | | (0.41) | | | (0.26) | | | (0.05) | |
The net unfavorable EAC adjustments in 2025 were primarily due to a $25.2 million unfavorable adjustment, including a $12.9 million loss reserve related to a program in the Company’s Defense Tech segment and $14.1 million unfavorable adjustments related to programs in the Space Europe reporting unit as a result of an increase in estimates made for the programmatic and technical assumptions based on the nature and technical complexity of the work to be performed to meet customer specifications. In addition, the Space segment also had further unfavorable adjustments due to production delays, additional unplanned labor and increased production costs as it relates to the development of advanced technologies required to meet customer specifications in multiple space offerings. The net unfavorable EAC adjustments in 2024 were primarily due to additional unplanned labor and test cycles required to meet customer requirements in the Company’s Space segment.
REDWIRE CORPORATION
NOTES TO CONSOLIDATED FINANCIAL STATEMENTS
(Tabular amounts in thousands of U.S. dollars, except percentages, unit, share, and warrant amounts)
Remaining Performance Obligations
As of December 31, 2025, the aggregate amount of the transaction price allocated to remaining performance obligations was $330.3 million. The Company expects to recognize approximately 54% of its remaining performance obligations as revenue within the next 12 months and the balance thereafter.
Note Q – Employee Benefit Plans
401(k) Plans
The Company maintained two qualified 401(k) plans, the Redwire 401(k) plan and Edge 401(k) plan, for its U.S. employees as of December 31, 2025. The Company maintained one qualified plan, the Redwire 401(k) plan for its U.S. employees as of December 31, 2024. During the years ended December 31, 2025, 2024 and 2023, the Company matched employee contributions 50% up to 8% for the Redwire 401(k) plan. During the year ended December 31, 2025, the Company matched employee contributions 100% up to 4% and 50% up to 6% for the Edge 401(k) plan.
The table below presents the expense for matching contributions for the following periods:
| | | | | | | | | | | | | | | | | |
| Year Ended |
| December 31, 2025 | | December 31, 2024 | | December 31, 2023 |
| | | | | |
| | | | | |
| | | | | |
| Total expense for matching contributions | $ | 3,276 | | | $ | 2,672 | | | $ | 2,367 | |
Note R – Equity-Based Compensation
Incentive Units
The Company’s former parent, AE Red Holdings, LLC (formerly known as Redwire Holdings, LLC) (“Holdings”) adopted a written compensatory benefit plan (the “Class P Unit Incentive Plan”) to provide incentives to existing or new employees, officers, managers, directors, or other service providers of the Company or its subsidiaries in the form of Holdings’ Class P Units (“Incentive Units”). As amended, the Tranche I and the Tranche III Incentive Units became fully vested in 2021. Holdings also amended the Class P Unit Incentive Plan so that the Tranche II Incentive Units would vest on any liquidation event, as defined in the Class P Unit Incentive Plan, rather than only upon consummation of the sale of Holdings, subject to the market-based condition stipulated in the Class P Unit Incentive Plan prior to its amendment. All compensation expense was recognized during 2021 and 2022 and as of December 31, 2025, Tranches I and III were fully vested and Tranche II is still subject to the market-based vesting condition. Subsequent to December 31, 2025, Tranche II met the market-based vesting condition and was fully vested.
The former parent of Edge Autonomy, Ultimate Holdings, adopted a written compensatory benefit plan (the “Edge Incentive Unit Plan”) to provide incentives to existing or new employees, officers, managers, directors, or other service providers of Edge Autonomy or its subsidiaries in the form of Ultimate Holdings’ Class A and B Units (“Edge Incentive Units”). In June 2025, Ultimate Holdings amended the Edge Incentive Unit Plan, which caused the Tranche I Edge Incentive Units to vest as of the amended date, the Tranche II Edge Incentive Units to vest on the first anniversary of the Edge Autonomy acquisition date, and the Tranche III Edge Incentive Units to vest on the second anniversary of the Edge Autonomy acquisition date. In connection with the amended Edge Incentive Unit Plan the Company determined the weighted average fair value at the modification date of the Edge Incentive Units as $13.94 per unit using Black-Scholes OPM with the following assumptions:
| | | | | |
| June 23, 2025 |
Strike price | $1.00 to $7.71 |
Redwire common stock price | $15.36 |
Time to exit | 1.52 to 2.52 years |
| Expected volatility | 94.00% to 89.30% |
| Risk-free rate of return | 3.88% to 3.78% |
| Expected annual dividend yield | — | % |
Both Tranche II and III vesting is subject to the employee’s continued employment with the Company. The fair value determined at the date of the amendment of the Edge Incentive Unit Plan was immediately recognized as compensation expense for Tranche I. Compensation expense for Tranche II and III is being derived over the service period of one and two years, respectively, and
REDWIRE CORPORATION
NOTES TO CONSOLIDATED FINANCIAL STATEMENTS
(Tabular amounts in thousands of U.S. dollars, except percentages, unit, share, and warrant amounts)
recognized on a straight-line basis. As of December 31, 2025, there was approximately $42.5 million of unrecognized compensation cost related to the Tranche II and III Edge Incentive Units expected to be recognized over a weighted-average period of 1.47 years.
2021 Omnibus Incentive Plan
Shares of the Company’s stock reserved for grants under the 2021 Omnibus Incentive Plan (the “Plan”) were 13,126,536 and 11,786,489 as of December 31, 2025 and December 31, 2024, respectively. Incentive stock options may only be granted to employees and officers employed by the Company. The Plan appoints the Board, the Compensation Committee or such other committee consisting of two or more individuals appointed by the Board to administer the Plan.
Stock Options
The Company’s Plan authorizes the grant of stock options (incentive and non-qualified) to purchase shares of the Company’s common stock with a contractual term of 10 years. The options vest over a three-year term as follows: 33.3% on the first anniversary of the grant date, 33.3% on the second anniversary of the grant date, and 33.4% on the third anniversary of the grant date. Vesting is contingent upon continued employment with or service to the Company; both the unexercised vested and unvested portions of an option will be immediately forfeited and canceled if employment or service ceases to the Company. The Company recognizes equity-based compensation expense for the options equal to the fair value of the awards on a straight-line basis over the requisite service period and recognizes forfeitures as they occur. The fair value of options granted under the Plan is estimated on the grant date under the Black-Scholes OPM.
The Company did not grant any options under the Plan during the years ended December 31, 2025, 2024 and 2023 and there were no forfeitures or expirations of stock options during the year ended December 31, 2025.
The table below presents the outstanding stock options under the Plan:
| | | | | | | | | | | | | | | | | | | | | | | | | | |
| | Number of Options | | Weighted-Average Grant Date Fair Value per Share | | Weighted-Average Exercise Price per Share | | Weighted-Average Remaining Contractual Term (Years) |
| | | | | | | | |
| | | | | | | | |
| | | | | | | | |
| | | | | | | | |
| | | | | | | | |
| | | | | | | | |
| | | | | | | | |
| | | | | | | | |
| | | | | | | | |
| | | | | | | | |
| | | | | | | | |
| | | | | | | | |
| | | | | | | | |
| | | | | | | | |
| | | | | | | | |
| | | | | | | | |
| | | | | | | | |
| | | | | | | | |
| | | | | | | | |
| | | | | | | | |
Outstanding as of December 31, 2024 | | 1,742,942 | | | $ | 2.64 | | | $ | 6.96 | | | 7.04 |
| | | | | | | | |
| Exercised | | (13,670) | | | 1.80 | | | 3.13 | | | |
| | | | | | | | |
| | | | | | | | |
Outstanding as of December 31, 2025 | | 1,729,272 | | | $ | 2.65 | | | $ | 6.99 | | | 6.04 |
As of December 31, 2025, there was no remaining unrecognized compensation cost related to stock options granted under the Plan and there were 1,729,272 stock options that were vested and exercisable. The intrinsic value of all options outstanding and exercisable at December 31, 2025 and 2024 was $3.4 million and $13.1 million, respectively.
Performance-based Restricted Stock Units
The Plan authorizes the grant of performance-based restricted stock units (“PSUs”). The PSUs generally vest upon completion of a three-year period (“Performance Period”). For awards granted in 2023 and 2024, the number of shares, if any, that are ultimately awarded is contingent upon the Company’s closing price per share at the end of the Performance Period and continued employment or service to the Company. The PSU award allows the grantee to earn between 0% and 200% of the target award based on the Company’s closing stock price per share at the end of the Performance Period. The performance share payout is based on a market condition, and as such, the awards are valued using a Monte Carlo simulation model on the grant date. The model generates the fair value of the award at the grant date, which is then recognized as compensation expense on a straight-line basis over the requisite service period. The Company recognizes forfeitures as they occur.
During the year ended December 31, 2025, the Company granted 346,240 PSUs to certain officers, managers and other eligible employees pursuant to the Plan. The PSU award allows the grantee to earn between 0% and 200% of the target award based on the Company’s share performance compared to the Russell Index 2000 Total Return for the period of January 1, 2025 through December 31, 2027 and is contingent on the continued employment with or service to the Company. The grant date fair value of these awards was $26.02 per share. Additionally, PSUs granted during 2023 vested as of December 31, 2025 at 200% of the target award which resulted in an additional 636,097 shares issued.
REDWIRE CORPORATION
NOTES TO CONSOLIDATED FINANCIAL STATEMENTS
(Tabular amounts in thousands of U.S. dollars, except percentages, unit, share, and warrant amounts)
The fair value of PSUs granted under the Plan was estimated on the grant date using a Monte Carlo simulation model with the following assumptions:
| | | | | | | | | | | | | | | | | |
| 2025 Grants | | 2024 Grants | | 2023 Grants |
Valuation date stock price | $ | 17.50 | | | $ | 7.45 | | | $ | 2.63 | |
Remaining term of performance period | 2.46 years | | 2.47 years | | 2.49 years |
| Expected volatility | 88.80 | % | | 71.50 | % | | 81.00 | % |
| Risk-free rate of return | 3.83 | % | | 4.34 | % | | 4.70 | % |
| Expected annual dividend yield | — | % | | — | % | | — | % |
The table below presents the outstanding PSUs under the Plan:
| | | | | | | | | | | | | | | | | | | | | | | | | | |
| | Number of PSUs | | Weighted-Average Grant Date Fair Value per Share | | Weighted-Average Remaining Contractual Term (in Years) | | Aggregate Intrinsic Value |
| | | | | | | | |
| | | | | | | | |
| | | | | | | | |
| | | | | | | | |
| | | | | | | | |
| | | | | | | | |
| | | | | | | | |
| | | | | | | | |
Outstanding as of December 31, 2024 | | 1,459,962 | | | $ | 8.48 | | | 1.6 | | $ | 24,031 | |
| Granted | | 982,337 | | | 11.21 | | | | | |
Vested | | (1,272,194) | | | 3.15 | | | | | |
| Forfeited | | (120,048) | | | 21.77 | | | | | |
Outstanding as of December 31, 2025 | | 1,050,057 | | | $ | 18.45 | | | 1.3 | | $ | 7,980 | |
As of December 31, 2025, total unrecognized compensation cost related to unvested PSUs granted under the Plan was $9.9 million and is expected to be recognized over a weighted-average period of 1.3 years.
Restricted Stock Units
Restricted stock units (“RSUs”) awarded under the Plan follow the same vesting conditions as the options described above and are generally subject to forfeiture in the event of termination of employment prior to vesting dates. The Company recognizes equity-based compensation expense for the RSUs equal to the grant date fair value of the awards on a straight-line basis over the requisite service period and recognizes forfeitures as they occur.
During 2025, the Company granted RSUs under the Plan to non-employee directors and certain officers, managers and other eligible employees pursuant to the Plan, respectively. The RSUs granted to non-employee directors vest over one year and the weighted average grant date fair value of these awards was $13.46 per share. Additionally, the Company granted 935,935 RSUs to certain officers, managers and other eligible employees. The RSUs follow the same vesting conditions as the options described above. The weighted average grant date fair value of these awards was $15.97 per share based on the closing price of the Company’s common stock on the respective grant date.
The table below presents the activity of RSUs under the Plan:
| | | | | | | | | | | | | | | | | | | | | | | |
| Number of RSUs | | Weighted-Average Grant Date Fair Value per Share | | Weighted-Average Remaining Contractual Term (in Years) | | Aggregate Intrinsic Value |
| | | | | | | |
| | | | | | | |
| | | | | | | |
| | | | | | | |
| | | | | | | |
| | | | | | | |
| | | | | | | |
| | | | | | | |
| | | | | | | |
| | | | | | | |
| | | | | | | |
| | | | | | | |
| | | | | | | |
| | | | | | | |
| | | | | | | |
| | | | | | | |
Unvested as of December 31, 2024 | 2,441,971 | | | $ | 4.93 | | | 1.1 | | $ | 40,195 | |
| Granted | 1,025,085 | | | 15.75 | | | | | |
| Vested | (1,326,773) | | | 4.56 | | | | | |
| Forfeited | (172,472) | | | 12.15 | | | | | |
Unvested as of December 31, 2025 | 1,967,811 | | | $ | 13.49 | | | 1.1 | | $ | 14,955 | |
| | | | | | | |
As of December 31, 2025, total unrecognized compensation cost related to unvested RSUs granted under the Plan was $16.2 million and is expected to be recognized over a weighted-average period of 1.7 years.
REDWIRE CORPORATION
NOTES TO CONSOLIDATED FINANCIAL STATEMENTS
(Tabular amounts in thousands of U.S. dollars, except percentages, unit, share, and warrant amounts)
Employee Stock Purchase Plan
On September 2, 2021, the Company’s Board adopted the Redwire Corporation 2021 Employee Stock Purchase Plan (the “ESPP”) which authorizes the grant of rights to purchase common stock of the Company to employees, officers and directors (if they are otherwise employees) of the Company. Shares of the Company’s common stock reserved for grants under the ESPP were 3,351,023 and 2,680,999 as of December 31, 2025 and 2024, respectively. The ESPP appoints the Compensation Committee to administer the ESPP. Under the ESPP, each offering has an enrollment period during which each eligible employee has the option to enroll allowing the eligible employee to purchase shares of the Company’s common stock at the end of the offering period. Each offering period under the ESPP is generally for five months, which can be modified from time to time. Subject to limitations, each participant will be permitted to purchase a number of shares determined by dividing the employee’s accumulated payroll deductions for the offering period by the applicable purchase price. The applicable purchase price is calculated as an amount equal to 85% of the fair market value of the Company’s common stock at either the beginning or end of each offering period, whichever is less. A participant must designate in the enrollment package the percentage (if any) up to 15% of compensation to be deducted during that offering period for the purchase of stock under the ESPP, subject to certain limitations. As of December 31, 2025, the Company had four completed offering periods and no active offering period.
The ESPP is considered a compensatory plan with the related compensation cost expensed over the five-month offering period. The Company utilizes the Black-Scholes OPM to compute the fair market value of shares under the ESPP for each offering period. As of December 31, 2025, an aggregate of 444,590 shares had been purchased and 2,906,433 shares were available for future sales under the ESPP.
The table below presents the equity-based compensation expense recorded for the following periods:
| | | | | | | | | | | | | | | | | | | | | | | | |
| | | | | | | | | | |
| | | Year Ended | | | |
| | | | | December 31, 2025 | | December 31, 2024 | | December 31, 2023 | | | |
| Cost of sales | | | | | | | | | | | | |
Edge Incentive Units | | | | | $ | 495 | | | $ | — | | | $ | — | | | | |
ESPP | | | | | 465 | | | 237 | | | — | | | | |
Stock options | | | | | — | | | 15 | | | 117 | | | | |
Restricted stock units | | | | | 1,720 | | | 1,903 | | | 2,540 | | | | |
Performance-based restricted stock units | | | | | 125 | | | 43 | | | 13 | | | | |
| Total cost of sales | | | | | $ | 2,805 | | | $ | 2,198 | | | $ | 2,670 | | | | |
| | | | | | | | | | | | |
| Selling, general and administrative expenses | | | | | | | | | | | | |
Edge Incentive Units | | | | | $ | 43,925 | | | $ | — | | | $ | — | | | | |
ESPP | | | | | 275 | | | 142 | | | — | | | | |
Stock options | | | | | 227 | | | 1,155 | | | 1,578 | | | | |
Restricted stock units | | | | | 5,843 | | | 5,117 | | | 3,982 | | | | |
Performance-based restricted stock units | | | | | 5,915 | | | 2,714 | | | 428 | | | | |
| Total selling, general and administrative expenses | | | | | $ | 56,185 | | | $ | 9,128 | | | $ | 5,988 | | | | |
| | | | | | | | | | | | |
| Total equity-based compensation expense | | | | | $ | 58,990 | | | $ | 11,326 | | | $ | 8,658 | | | | |
REDWIRE CORPORATION
NOTES TO CONSOLIDATED FINANCIAL STATEMENTS
(Tabular amounts in thousands of U.S. dollars, except percentages, unit, share, and warrant amounts)
Note S – Net Income (Loss) per Common Share
The table below presents a reconciliation of the basic and diluted net income (loss) per share that were computed for the following periods:
| | | | | | | | | | | | | | | | | | | | | |
| | | | | | | |
| | | Year Ended |
| | | | | | December 31, 2025 | | December 31, 2024 | | December 31, 2023 |
Numerator: | | | | | | | | | |
| Net income (loss) attributable to Redwire Corporation | | | | | $ | (226,552) | | | $ | (114,315) | | | $ | (27,263) | |
| Less: dividends on Convertible Preferred Stock | | | | | 45,777 | | | 41,052 | | | 20,021 | |
| Net income (loss) available to common shareholders | | | | | $ | (272,329) | | | $ | (155,367) | | | $ | (47,284) | |
| | | | | | | | | |
Denominator: | | | | | | | | | |
Weighted-average common shares outstanding: | | | | | | | | | |
Basic and diluted | | | | | 119,544,268 | | | 66,146,155 | | | 64,654,153 | |
| | | | | | | | | |
Net income (loss) per common share: | | | | | | | | | |
| Basic and diluted | | | | | $ | (2.28) | | | $ | (2.35) | | | $ | (0.73) | |
| | | | | | | | | |
Net income (loss) available to common shareholders (the numerator) is calculated by deducting both dividends declared and accumulated, regardless of the form of payment, during the period from Net income (loss) attributable to Redwire Corporation as presented on the consolidated statements of operations and comprehensive income (loss).
Basic net income (loss) per common share is computed by dividing net income (loss) available to common shareholders by the weighted-average number of common shares outstanding during the period. Diluted net income (loss) per common share is computed by dividing net income (loss) available to common shareholders by the weighted-average number of common shares and common equivalent shares outstanding for the periods presented using the treasury-stock method or, for participating securities, the if-converted method or two-class method, whichever is more dilutive. Common equivalent shares outstanding includes the dilutive effects from the assumed issuance, exercise or conversion of warrants, equity-based awards, and the Convertible Preferred Stock, except when antidilutive.
Because the Company had a net loss for all periods presented, the Company did not have any dilutive securities and/or other contracts that could, potentially, be exercised or converted into shares of common stock and then share in the earnings of the Company. As a result, diluted net income (loss) per common share is the same as basic net income (loss) per common share for the periods presented. Please refer to Note D – Fair Value of Financial Instruments, Note K – Warrants and Capital Stock Transactions, Note N – Convertible Preferred Stock, and Note R – Equity-Based Compensation for additional information on the Company’s warrants, Convertible Preferred Stock, and equity-based compensation awards, respectively.
Note T – Related Parties
A customer of the Company, Related Party A, is a related party because Kirk Konert, a member of the Company’s Board, also serves on the board of directors for the customer effective as of the second quarter of 2022. Peter Cannito, the Company’s Chairman, CEO and President, also served on the board of directors for the customer from the second quarter of 2022 through the fourth quarter of 2024.
A customer of the Company, Related Party B, is a related party because AEI acquired a majority interest in the customer during the fourth quarter of 2022 and Kirk Konert, a member of the Company’s Board, also serves on the board of directors for this customer.
REDWIRE CORPORATION
NOTES TO CONSOLIDATED FINANCIAL STATEMENTS
(Tabular amounts in thousands of U.S. dollars, except percentages, unit, share, and warrant amounts)
The table below presents details of the Company’s related party transactions included in the consolidated balance sheets and the consolidated statements of operations and comprehensive income (loss) for the following periods:
| | | | | | | | | | | | | | | | | | | | | |
| | | | | | | |
| | | | | As of | | |
| | | | | December 31, 2025 | | December 31, 2024 | | |
| Accounts receivable: | | | | | | | | | |
| Related Party A | | | | | $ | 330 | | | $ | 40 | | | |
| Related Party B | | | | | 45 | | | 748 | | | |
| | | | | $ | 375 | | | $ | 788 | | | |
| | | | | | | | | |
| | | Year Ended |
| | | | | December 31, 2025 | | December 31, 2024 | | December 31, 2023 |
| Revenues: | | | | | | | | | |
| Related Party A | | | | | $ | 1,409 | | | $ | 1,428 | | | $ | 955 | |
Related Party B | | | | | 1,775 | | | 9,072 | | | 8,250 | |
| | | | | $ | 3,184 | | | $ | 10,500 | | | $ | 9,205 | |
In the normal course of business, the Company participates in related party transactions with certain vendors and customers where AEI maintains a significant ownership interest and/or can exhibit significant influence on the operations of such parties. For the years ended December 31, 2025, 2024 and 2023, respectively, transactions with other companies in AEI’s investment portfolio, not separately disclosed, did not have a material impact on the Company’s consolidated financial statements.
Please refer to Note I – Debt and Note N – Convertible Preferred Stock, for related party transactions associated with the Company’s debt and Convertible Preferred Stock.
Note U – Segment Reporting
Operating segments are defined as components of an entity for which separate financial information is available and regularly reviewed by the Chief Operating Decision Maker (“CODM”) in deciding how to allocate resources and in assessing performance. The Company’s CODM is its Chief Executive Officer.
During the fourth quarter of 2025, the Company reorganized its segment structure to align with the strategic offerings of each business segment and the way the CODM assesses performance and makes capital allocation decisions. The Company previously operated in one operating segment and one reportable segment. Prior period segment information has been revised to reflect the reorganized segment structure.
As of December 31, 2025, the Company began operating in two operating segments and two reportable segments, Space and Defense Tech. The Space segment develops and provides next-generation spacecraft, large infrastructure, and microgravity capabilities to serve civil, national security, and commercial space customers. The Defense Tech segment develops and provides combat proven autonomous systems, optical sensors and radio frequency payloads that provide intelligence, surveillance, and reconnaissance capabilities for U.S. and allied nations across multiple domains.
Effective December 2025, the CODM assesses segment performance and decides how to allocate resources based on Segment Adjusted EBITDA, a non-GAAP measure, defined as income (loss) before taxes, excluding, depreciation and amortization, impairment expense, transaction expenses, acquisition integration costs, acquisition earnout costs, purchase accounting fair value adjustment related to deferred revenue and inventory, severance costs, disposal of long-lived assets, equity-based compensation and gains on sale of joint ventures, net of costs incurred. Segment Adjusted EBITDA also excludes intra- and inter-segment sales and costs and corporate pushdown costs. Total asset information is not included in the following summary since the CODM does not regularly review such information for the reportable segments.
The Company has intra- and inter-segment sales and costs, which are eliminated in the reportable Segment Adjusted EBITDA figures below. The Company had $5.6 million, $4.8 million and $7.0 million of inter-segment sales and costs during the years ended
REDWIRE CORPORATION
NOTES TO CONSOLIDATED FINANCIAL STATEMENTS
(Tabular amounts in thousands of U.S. dollars, except percentages, unit, share, and warrant amounts)
December 31, 2025, 2024 and 2023, respectively, which are eliminated in consolidation. Further information related to the Company’s products and services and geographical distribution of revenues is disclosed in Note P – Revenues.
The following tables provide a reconciliation of Segment Adjusted EBITDA to consolidated income (loss) before taxes:
| | | | | | | | | | | | | | | | | |
| Year Ended December 31, 2025 | Space | | Defense Tech | | Total |
Revenues | $ | 209,817 | | | $ | 125,564 | | | $ | 335,381 | |
| Less: | | | | | |
Cost of sales | 202,482 | | | 115,614 | | | 318,096 | |
Selling, general and administrative | 19,093 | | | 87,205 | | | 106,298 | |
| Transaction expenses | — | | | 115 | | | 115 | |
Impairment expense | 34,420 | | | 265 | | | 34,685 | |
Research and development | 2,977 | | | 15,918 | | | 18,895 | |
| Reportable segment income (loss) from operations | $ | (49,155) | | | $ | (93,553) | | | $ | (142,708) | |
Less: | | | | | |
Other (income) expense, net | (4,041) | | | 1,009 | | | (3,032) | |
| Add: | | | | | |
Depreciation and amortization expense | 7,784 | | | 22,735 | | | 30,519 | |
Purchase accounting fair value adjustment related to inventory | — | | | 13,645 | | | 13,645 | |
Impairment expense | 34,420 | | | 265 | | | 34,685 | |
Severance costs | 2,817 | | | 73 | | | 2,890 | |
Equity-based compensation expense | 4,151 | | | 45,891 | | | 50,042 | |
Transaction expenses | — | | | 115 | | | 115 | |
| Acquisition integration cost | 593 | | | 547 | | | 1,140 | |
Disposal of long-lived assets | 243 | | | 404 | | | 647 | |
Reportable Segment Adjusted EBITDA | $ | 4,894 | | | $ | (10,887) | | | $ | (5,993) | |
| | | | | |
Reconciliation of reportable segment results to consolidated income (loss) before taxes: | | | | | |
| Interest expense, net | | | | | (39,704) | |
| | | | | |
| Depreciation and amortization expense | | | | | (32,639) | |
Severance costs | | | | | (3,789) | |
| Equity-based compensation expense | | | | | (58,990) | |
Transaction expenses | | | | | (21,236) | |
All other corporate charges(1) | | | | | (38,102) | |
| | | | | |
| Loss on extinguishment of debt | | | | | (996) | |
Impairment expense | | | | | (34,685) | |
Purchase accounting fair value adjustment related to inventory | | | | | (13,645) | |
| Acquisition integration cost | | | | | (1,140) | |
Disposal of long-lived assets | | | | | (647) | |
Income (loss) before income taxes | | | | | $ | (251,566) | |
(1) All other corporate charges mainly consists of corporate overhead costs maintained at the corporate level. These expenses include costs relating to treasury, accounting, consulting, advisory, legal, tax and audit, insurance, financial reporting services and various administrative expenses related to the corporate headquarters.
REDWIRE CORPORATION
NOTES TO CONSOLIDATED FINANCIAL STATEMENTS
(Tabular amounts in thousands of U.S. dollars, except percentages, unit, share, and warrant amounts)
| | | | | | | | | | | | | | | | | |
| Year Ended December 31, 2024 | Space | | Defense Tech | | Total |
Revenues | $ | 255,336 | | | $ | 48,765 | | | $ | 304,101 | |
| Less: | | | | | |
| Cost of sales | 222,927 | | | 36,719 | | | 259,646 | |
| Selling, general and administrative | 11,971 | | | 1,973 | | | 13,944 | |
| Transaction expenses | 6 | | | — | | | 6 | |
| Research and development | 4,333 | | | 1,524 | | | 5,857 | |
Reportable segment income (loss) from operations | $ | 16,099 | | | $ | 8,549 | | | $ | 24,648 | |
Less: | | | | | |
| Other (income) expense, net | 334 | | | 16 | | | 350 | |
| Add: | | | | | |
| Depreciation and amortization expense | 7,577 | | | 2,897 | | | 10,474 | |
Severance costs | 724 | | | 63 | | | 787 | |
| Equity-based compensation expense | 3,049 | | | 1,045 | | | 4,094 | |
Transaction expenses | 6 | | | — | | | 6 | |
| Acquisition integration cost | 385 | | | — | | | 385 | |
| (Gain) Loss on Sale of Investment, net | (1,255) | | | — | | | (1,255) | |
Reportable Segment Adjusted EBITDA | $ | 26,251 | | | $ | 12,538 | | | $ | 38,789 | |
| | | | | |
Reconciliation of reportable segment results to consolidated income (loss) before taxes: | | | | | |
| Interest expense, net | | | | | (13,483) | |
| | | | | |
| Depreciation and amortization expense | | | | | (11,692) | |
Severance costs | | | | | (867) | |
| Equity-based compensation expense | | | | | (11,326) | |
Transaction expenses | | | | | (9,129) | |
All other corporate charges(1) | | | | | (109,493) | |
| | | | | |
| Acquisition integration cost | | | | | (385) | |
Gain (loss) on sale of investment, net | | | | | 1,255 | |
Income (loss) before income taxes | | | | | $ | (116,331) | |
| | | | | |
| | | | | |
(1) All other corporate charges mainly consists of corporate overhead costs maintained at the corporate level. These expenses include costs relating to treasury, accounting, consulting, advisory, legal, tax and audit, insurance, financial reporting services and various administrative expenses related to the corporate headquarters.
REDWIRE CORPORATION
NOTES TO CONSOLIDATED FINANCIAL STATEMENTS
(Tabular amounts in thousands of U.S. dollars, except percentages, unit, share, and warrant amounts)
| | | | | | | | | | | | | | | | | |
| Year Ended December 31, 2023 | Space | | Defense Tech | | Total |
Revenues | $ | 194,000 | | | $ | 49,800 | | | $ | 243,800 | |
| Less: | | | | | |
| Cost of sales | 149,298 | | | 36,533 | | | 185,831 | |
| Selling, general and administrative | 13,008 | | | 3,392 | | | 16,400 | |
| | | | | |
| | | | | |
| Research and development | 4,073 | | | 707 | | | 4,780 | |
Reportable segment income (loss) from operations | $ | 27,621 | | | $ | 9,168 | | | $ | 36,789 | |
Less: | | | | | |
| Other (income) expense, net | (687) | | | (261) | | | (948) | |
| Add: | | | | | |
| Depreciation and amortization expense | 7,713 | | | 2,835 | | | 10,548 | |
| | | | | |
Severance costs | 99 | | | (27) | | | 72 | |
| Equity-based compensation expense | 2,410 | | | 1,033 | | | 3,443 | |
| | | | | |
| Purchase accounting fair value adjustment related to deferred revenue | 15 | | | — | | | 15 | |
Reportable Segment Adjusted EBITDA | $ | 38,545 | | | $ | 13,270 | | | $ | 51,815 | |
| | | | | |
Reconciliation of reportable segment results to consolidated income (loss) before taxes: | | | | | |
| Interest expense, net | | | | | (10,699) | |
| | | | | |
| Depreciation and amortization expense | | | | | (10,724) | |
Severance costs | | | | | (313) | |
| Equity-based compensation expense | | | | | (8,658) | |
Transaction expenses | | | | | (13) | |
| | | | | |
All other corporate charges(1) | | | | | (49,143) | |
| | | | | |
| Purchase accounting fair value adjustment related to deferred revenue | | | | | (15) | |
Income (loss) before income taxes | | | | | $ | (27,750) | |
(1) All other corporate charges mainly consists of corporate overhead costs maintained at the corporate level. These expenses include costs relating to treasury, accounting, consulting, advisory, legal, tax and audit, insurance, financial reporting services and various administrative expenses related to the corporate headquarters.
Capital Expenditures
The following table provides a capital expenditures by segment:
| | | | | | | | | | | | | | | | | |
| December 31, 2025 | | December 31, 2024 | | December 31, 2023 |
Capital expenditures | | | | | |
Space | $ | 8,393 | | | $ | 5,905 | | | $ | 4,046 | |
Defense Tech | 6,483 | | | 330 | | | 1,874 | |
Total segment capital expenditures | $ | 14,876 | | | $ | 6,235 | | | $ | 5,920 | |
Corporate activities | 8,404 | | | 4,681 | | | 2,407 | |
Total capital expenditures | $ | 23,280 | | | $ | 10,916 | | | $ | 8,327 | |
| | | | | |
| | | | | |
| | | | | |
Note V – Subsequent Events
On February 20, 2026, the Company amended and restated the JPM Credit Agreement (the “JPM Amended and Restated Credit Agreement”) with JPMorgan Chase Bank, N.A., as administrative agent and collateral agent. The JPM Amended and Restated Credit Agreement amends and restates the JPM Credit Agreement and provides for a revolving credit facility with commitments in an aggregate principal amount of up to $30 million, maturing May 31, 2029. The JPM Amended and Restated Credit Agreement also replaced the term loan under the JPM Credit Agreement with a new $90 million term loan, effectively extending the maturity date of the term loan from April 28, 2027 to May 31, 2029. The borrowings under the JPM Amended and Restated Credit Agreement bear interest at a rate per annum equal to, at the Company’s option, either (i) the SOFR plus an applicable margin or (ii) a base rate plus an
applicable margin. The applicable margin ranges from 3.25% to 3.75% per annum for SOFR loans and 2.25% to 2.75% per annum for base rate loans.
Additionally, on February 20, 2026, the Company terminated the Adams Street Credit Agreement in accordance with its terms. The Adams Street Credit Agreement was due to mature April 28, 2027. The Company did not incur any termination penalties as a result of such termination.
Item 9. Changes in and Disagreements With Accountants on Accounting and Financial Disclosures
None.
Item 9A. Controls and Procedures
Evaluation of Disclosure Controls and Procedures
We maintain disclosure controls and procedures (as defined in Rules 13a-15(e) and 15d-15(e) under the Exchange Act) that are designed to ensure that information required to be disclosed in our Exchange Act reports is recorded, processed, summarized and reported within the time periods specified in the SEC’s rules and forms, and that such information is accumulated and communicated to our management, including our principal executive officer and principal financial officer, as appropriate, to allow for timely decisions regarding required disclosure. Our management, including our Chief Executive Officer and Chief Financial Officer, does not expect that our disclosure controls and procedures or our internal control over financial reporting will prevent all errors and all fraud due to inherent limitations of internal controls. Because of such limitations, there is a risk that material misstatements will not be prevented or detected on a timely basis by internal control over financial reporting. However, these inherent limitations are known features of the financial reporting process. Therefore, it is possible to design into the process safeguards to reduce, though not eliminate, this risk. As required by Rules 13a-15(b) and 15d-15(b) under the Exchange Act, we have carried out an evaluation, under the supervision and with the participation of our management, including our principal executive officer and our principal financial officer, of the effectiveness of the design and operation of our disclosure controls and procedures. Based on such evaluation, our principal executive officer and principal financial officer concluded that, as of the end of the period covered by this report, certain of our disclosure controls and procedures were not effective as of December 31, 2025 due to the material weaknesses in internal control over financial reporting described below.
Notwithstanding such material weaknesses in our internal control over financial reporting, our management, including our principal executive officer and principal financial officer, concluded that our consolidated financial statements in this Annual Report on Form 10-K present fairly, in all material respects, our financial position, results of operations and cash flows for the periods presented, in conformity with U.S. generally accepted accounting principles.
Management’s Report on Internal Control Over Financial Reporting
Our management is responsible for establishing and maintaining adequate internal control over financial reporting (as defined in Rules 13a-15(f) and 15d-15(f) under the Exchange Act). Because of its inherent limitations, internal control over financial reporting may not prevent or detect misstatements. Also, projections of any evaluation of effectiveness to future periods are subject to the risk that controls may become inadequate because of changes in conditions or that the degree of compliance with the policies or procedures may deteriorate. Our management, with the participation of our principal executive officer and principal financial officer, under the oversight of our Board of Directors, conducted an assessment of the effectiveness of our internal control over financial reporting as of December 31, 2025. This assessment was based on the criteria set forth by the Internal Control – Integrated Framework (2013) issued by the Committee of Sponsoring Organizations of the Treadway Commission. Our assessment of internal control over financial reporting did not include the internal control over financial reporting for Redwire Defense Tech Intermediate Holdings, LLC (formerly known as Edge Autonomy Intermediate Holdings, LLC), which was acquired in a business combination in the second quarter of 2025. Redwire Defense Tech Intermediate Holdings, LLC’s total assets and revenues represent 10% and 32%, respectively, of the Company’s consolidated total assets and total revenues as of and for the year ended December 31, 2025. Based on this assessment, management concluded that our internal control over financial reporting was not effective as of December 31, 2025 because of the material weaknesses described below.
A material weakness is a deficiency, or combination of deficiencies, in internal control over financial reporting, such that there is a reasonable possibility that a material misstatement of our annual or interim consolidated financial statements will not be prevented or detected on a timely basis.
Management identified the following material weaknesses in internal control over financial reporting as of December 31, 2025:
•For substantially all of our U.S. operations, we designed process-level control activities pervasive across our financial reporting processes, but we were unable to fully deploy those process-level control activities with sufficient time to demonstrate their operating effectiveness.
•For European and remaining U.S. operations:
◦Due to insufficient time and resources, we did not (i) establish effective information technology (“IT”) general controls (“ITGCs”), specifically program change controls and access controls, that support the consistent operation of the Company’s IT operating systems, databases and IT applications, and end user computing over all financial reporting; and, ii) have policies and procedures through which ITGCs are deployed across the organization. Automated process-level controls and manual controls dependent upon the accuracy and completeness of information derived from IT systems were also rendered ineffective because they are affected by the lack of ITGCs.
◦As a result, we did not effectively design, implement or operate process-level control activities pervasive across our financial reporting processes.
The material weaknesses above did not result in a material misstatement to the consolidated financial statements as of and for the year ended December 31, 2025. However, the control deficiencies described above created a reasonable possibility that a material misstatement to the consolidated financial statements would not be prevented or detected on a timely basis if one were to occur.
Our independent registered public accounting firm, KPMG LLP, who audited the consolidated financial statements included in this Annual Report on Form 10-K, has also audited the effectiveness of our internal control over financial reporting as of December 31, 2025, and issued an adverse opinion on the effectiveness of our internal control over financial reporting. KPMG LLP’s report appears on page 62 of this Annual Report on Form 10-K.
Material Weaknesses in Excluded Acquired Business
In the second quarter of 2025, the Company acquired Redwire Defense Tech Intermediate Holdings, LLC. Prior to the acquisition, Redwire Defense Tech Intermediate Holdings, LLC’s management identified material weaknesses in its internal control over financial reporting, due to a lack of ITGCs and effective process-level control activities similar to those identified above related to the Company’s European and certain U.S. operations. These material weaknesses continue to exist as of December 31, 2025.
These material weaknesses did not result in any material misstatements to the consolidated financial statements as of and for the year ended December 31, 2025.
Management’s Remediation Plans
Management, with oversight from the Board of Directors, continues to implement a remediation plan to address the material weaknesses. The Company made progress during 2025 in its remediation of the material weaknesses as further described below.
•For substantially all of our U.S. operations we have designed and implemented both manual and automated process-level control activities but due to insufficient time and resources, we were unable to demonstrate their operating effectiveness. We plan to do so, through testing, during 2026.
For our European and remaining U.S. operations, including Redwire Defense Tech Intermediate Holdings, LLC, we will continue our remediation efforts including:
•Implementing one enterprise resource planning (“ERP”) system for our European operations and expanding the implementation of our U.S. ERP system for our remaining U.S. operations.
•Continuing our engagement of a third-party global consulting firm to accelerate the deployment of ITGCs and manual and automated process-level controls across our financial reporting process.
•Continuing to assess the specific training needs of personnel and developing and delivering training programs designed to uphold our internal control standards.
We believe the above actions will be effective in remediating the material weaknesses described above. However, the material weaknesses cannot be considered remediated until remediated controls operate for a sufficient period of time and management has concluded, through testing, that these controls are operating effectively. Although we intend to complete the remediation of remaining processes as promptly as possible, we cannot at this time estimate how long it will take to remediate the material weaknesses described
above. We may discover additional material weaknesses that require additional time and resources to remediate, and we may decide to take additional measures to address the material weaknesses or modify the remediation steps described above.
If we are unable to successfully remediate existing or any future material weaknesses in our internal control over financial reporting, the accuracy and timing of our financial reporting may be adversely affected, investors may lose confidence in our financial reporting, and/or we could become subject to litigation or investigations by the New York Stock Exchange, the SEC or other regulatory authorities.
Changes in Internal Control over Financial Reporting
The Company has made the following changes to its internal control over financial reporting during the three months ended December 31, 2025 for substantially all of our U.S. operations to remediate certain of the material weaknesses that were present as of December 31, 2024:
•Implemented a new ERP system.
•Implemented effective ITGCs, including program change controls and access controls, that support the consistent operation of the company’s IT operating systems, databases and IT applications, and end user computing over financial reporting, and ensured they will support process-level automated and manual control activities that are dependent upon information derived from IT systems.
Except for these changes, there has been no change in the Company’s internal control over financial reporting (as such term is defined in Rules 13a-15(f) and 15d-15(f) under the Exchange Act) during the quarter ended December 31, 2025, that has materially affected, or is reasonably likely to materially affect, our internal control over financial reporting.
Item 9B. Other Information
During the three months ended December 31, 2025, no director or officer of the Company adopted or terminated a “Rule 10b5-1 Trading Arrangement” or a “Non-Rule 10b5-1 Trading Arrangement” as each term is defined in Item 408 of Regulation S-K.
Item 9C. Disclosure Regarding Foreign Jurisdictions that Prevent Inspections
Not applicable.
Part III
Item 10. Directors, Executive Officers and Corporate Governance
The information required by this item will be contained in our Proxy Statement for the Company’s 2026 Annual Meeting of Shareholders under the headings “Board of Directors and Corporate Governance”, “Proposal 1 – Election of Directors” and “Executive Officers”, and is incorporated herein by reference.
Item 11. Executive Compensation
The information required by this item will be contained in our Proxy Statement for the Company’s 2026 Annual Meeting of Shareholders under the heading “Executive and Director Compensation” and is incorporated herein by reference.
Item 12. Security Ownership of Certain Beneficial Owner and Management and Related Stockholder Matters
Equity Compensation Plan Information
The following table sets forth information regarding the Company’s equity compensation plans as of December 31, 2025:
| | | | | | | | | | | | | | | | | | | | |
| Plan Category | | Number of Securities to be Issued Upon Exercise of Outstanding Options, Warrants and Rights(ii) | | Weighted-Average Exercise Price of Outstanding Options, Warrants and Rights(iii) | | Number of Securities Remaining Available for Future Issuances Under Equity Compensation Plans (Excluding Securities Reflecting in First Column) |
Equity Compensation Plans Approved by Security Holders(i) | | 4,747,140 | | | $ | 6.99 | | | 3,978,214 | |
| Equity Compensation Plans Not Approved by Security Holders | | — | | | — | | | — | |
| Total | | 4,747,140 | | | $ | 6.99 | | | 3,978,214 | |
(i) Includes the Redwire Corporation 2021 Omnibus Incentive Plan (“the Plan”) and the Redwire Corporation 2021 Employee Stock Purchase Plan (the “ESPP”). As of December 31, 2025, the number of shares reserved for issuance under the Plan and the 2021 ESPP were 13,126,536 shares and 3,351,023 shares, respectively. The number of shares reserved for issuance under the Plan automatically increases each January 1st prior to the termination of the plan, in an amount equal to the lesser of 2% of the total number of shares of common stock outstanding on December 31st of the preceding calendar year or such lesser number of shares as determined by the Board. The total number of shares reserved for issuance under the ESPP automatically increases for a period of up to ten years, which period began on January 1, 2022, in an amount equal to the lesser of 1% of the total number of shares of common stock outstanding on December 31st of the preceding calendar year, or such lesser number of shares as determined by the Board; provided, however, no more than 8,000,000 shares of common stock may be issued in total under the plan.
(ii) Includes 1,967,811 restricted stock units (“RSUs”), 1,050,057 performance-based restricted stock units (“PSUs”), and options to purchase 1,729,272 shares of common stock, each granted and outstanding under the Plan.
(iii) Excludes restricted stock units, which have no exercise price.
The remaining information required by this item will be contained in our Proxy Statement for the Company’s 2026 Annual Meeting of Shareholders under the heading “Security Ownership of Certain Beneficial Owners and Management” and is incorporated herein by reference.
Item 13. Certain Relationships and Related Transactions, and Director Independence
The information required by this item will be contained in our Proxy Statement for the Company’s 2026 Annual Meeting of Shareholders under the headings “Certain Relationships and Related Party Transactions” and “Board of Directors and Corporate Governance”, and is incorporated herein by reference.
Item 14. Principal Accounting Fees and Services
The information required by this item will be contained in our Proxy Statement for the Company’s 2026 Annual Meeting of Shareholders under the heading “Proposal 2 – Ratification of Appointment of Independent Registered Public Accounting Firm” and is incorporated herein by reference.
PART IV
Item 15. Exhibits, Financial Statement Schedules
The following documents are filed as a part of this Form 10-K:
(a)(1) All Financial Statements
| | | | | |
| Index to Financial Statements | Page |
Consolidated Balance Sheets | |
Consolidated Statements of Operations and Comprehensive Income (Loss) | |
Consolidated Statements of Changes in Equity (Deficit) | |
Consolidated Statements of Cash Flows | |
Notes to Consolidated Financial Statements | |
(a)(2) Financial Statement Schedules
None.
(a)(3) Exhibits.
The following exhibits are filed as part of or incorporated by reference into this Form 10-K:
| | | | | | | | | | | | |
| | | | | |
Exhibit
Number | | Description | | | | | | |
| 2.1† | | | | | | | | |
| | | | | | | | |
2.2† | | Agreement and Plan of Merger, dated as of January 20, 2025, by and among Redwire Corporation, Edge Autonomy Ultimate Holdings, LP, Edge Autonomy Intermediate Holdings, LLC, Echelon Merger Sub, Inc., and Echelon Purchaser, LLC (incorporated by reference to Exhibit 2.1 to the Current Report on Form 8-K filed by the Registrant on January 21, 2025). | | | | | | |
| 2.3† | | Amendment, dated as of June 8, 2025, by and among Redwire Corporation, Edge Autonomy Ultimate Holdings, LP, Edge Autonomy Intermediate Holdings, LLC, Echelon Merger Sub, Inc., and Echelon Purchaser, LLC (incorporated by reference to Exhibit 2.1 to the Current Report on Form 8-K filed by the Registrant on June 9, 2025). | | | | | | |
| 3.1 | | | | | | | | |
| 3.2 | | | | | | | | |
| 3.3 | | | | | | | | |
| 3.4 | | | | | | | | |
3.5 | | | | | | | | |
| 4.1 | | | | | | | | |
| 4.2 | | | | | | | | |
| 4.3 | | | | | | | | |
4.4 | | Registration Rights Coordination Agreement, dated as of June 8, 2025, by and among Redwire Corporation, BCC Redwire Aggregator, L.P., AE Industrial Partners Fund II, L.P., and AE Industrial Partners Structured Solutions I, L.P. (incorporated by reference to Exhibit 10.1 to the Current Report on Form 8-K filed by the Registrant on June 9, 2025). | | | | | | |
| | | | | | | | |
| | | | | | | | |
| | | | | | | | | | | | |
| | | | | |
Exhibit
Number | | Description | | | | | | |
10.1 | | | | | | | | |
| | | | | | | | |
| | | | | | | | |
10.2+ | | | | | | | | |
10.3+ | | | | | | | | |
10.4+ | | | | | | | | |
10.5+ | | | | | | | | |
10.6+ | | | | | | | | |
10.7+ | | | | | | | | |
10.8+ | | | | | | | | |
10.9 | | Credit Agreement, dated as of October 28, 2020, by and among Cosmos Finance, LLC, Cosmos Acquisition, LLC, the other Borrowers, Guarantors and Lenders (as defined therein) from time to time parties thereto, Adams Street Credit Advisors LP, as administrative agent and collateral agent and Adams Street Credit Advisors LP, as sole lead arranger and sole bookrunner (incorporated by reference to Exhibit 10.13 to the Registrant’s Annual Report on Form 10-K filed on April 11, 2022). | | | | | | |
10.10 | | First Amendment to Credit Agreement, dated as of February 17, 2021, by and among Cosmos Acquisition, LLC, Cosmos Finance, LLC, the other Borrowers, Guarantors and Lenders (as defined therein) from time to time parties thereto, Adams Street Credit Advisors LP, as administrative agent and collateral agent and the First Amendment Term Lenders (as defined therein) (incorporated by reference to Exhibit 10.14 to the Registrant’s Annual Report on Form 10-K filed with the SEC on April 11, 2022). | | | | | | |
10.11 | | Second Amendment to Credit Agreement, dated as of September 2, 2021, by and among Redwire Holdings, LLC, formerly known as Cosmos Acquisition, LLC, Redwire Intermediate Holdings, LLC, formerly known as Cosmos Finance, LLC, the other Borrowers, Guarantors and Lenders (as defined therein) from time to time parties thereto and Adams Street Credit Advisors LP, as administrative agent and collateral agent (incorporated by reference to Exhibit 10.15 to the Registrant’s Annual Report on Form 10-K filed with the SEC on April 11, 2022). | | | | | | |
10.12 | | Third Amendment to Credit Agreement, dated as of March 25, 2022, by and between Redwire Holdings, LLC, the other Borrowers party thereto, the Guarantors party thereto, Adams Street Credit Advisors, LP, as Administrative Agent and as Collateral Agent and each lender party thereto (incorporated by reference to Exhibit 10.1 to the Registrant’s Current Report on Form 8-K filed on March 30, 2022. | | | | | | |
10.13+ | | | | | | | | |
| | | | | | | | |
| | | | | | | | |
| | | | | | | | |
| | | | | | | | |
10.14+ | | | | | | | | |
| | | | | | | | |
10.15 | | Fourth Amendment to Credit Agreement, dated as of August 8, 2022, by and between Redwire Holdings, LLC, the other Borrowers party thereto, the Guarantors party thereto, Adams Street Credit Advisors, LP, as Administrative Agent and as Collateral Agent and each lender party thereto (incorporated by reference to Exhibit 10.1 to the Current Report on Form 8-K filed by the Registrant on August 12, 2022). | | | | | | |
10.16+ | | | | | | | | |
10.17+ | | | | | | | | |
10.18 | | | | | | | | |
10.19 | | Fifth Amendment to Credit Agreement, dated as of October 28, 2022, by and between Redwire Holdings, LLC, Redwire Intermediate Holdings, LLC, the other Borrowers party thereto, the other Guarantors party thereto, Adams Street Credit Advisors, LP, as Administrative Agent and as Collateral Agent and each lender party thereto (incorporated by reference to Exhibit 10.1 to the Current Report on Form 8-K filed by the Registrant on November 2, 2022). | | | | | | |
| | | | | | | | |
| | | | | | | | |
| | | | | | | | | | | | |
| | | | | |
Exhibit
Number | | Description | | | | | | |
10.20 | | Sixth Amendment to Credit Agreement, dated as of June 23, 2023 by and between Redwire Holdings, LLC, Redwire Intermediate Holdings, LLC, the other Borrowers party thereto, the other Guarantors party thereto, Adams Street Credit Advisors, LP, as Administrative Agent and as Collateral Agent and each lender party thereto (incorporated by reference to Exhibit 10.1 to the Current Report on Form 8-K filed by the registrant on June 23, 2023). | | | | | | |
10.21+ | | | | | | | | |
10.22+ | | | | | | | | |
10.23 | | Seventh Amendment to Credit Agreement, dated as of December 22, 2023, by and among Redwire Holdings, LLC, the other Borrowers party thereto, the Guarantors party thereto, Adams Street Credit Advisors, LP, as Administrative Agent and as Collateral Agent and each lender party thereto (incorporated by reference to Exhibit 10.1 to the Current Report on Form 10-K filed by the registrant on December 27, 2023). | | | | | | |
10.24 | | Eighth Amendment to Credit Agreement, dated as of June 18, 2024, by and among Redwire Holdings, LLC, the other Borrowers party thereto, the Guarantors party thereto, Adams Street Credit Advisors, LP, as Administrative Agent and as Collateral Agent and each lender party thereto (incorporated by reference to Exhibit 10.1 to the Current Report on Form 8-K filed by the registrant on June 20, 2024). | | | | | | |
10.25 | | Ninth Amendment to Credit Agreement, dated as of August 28, 2024, by and among Redwire Holdings, LLC, the other Borrowers party thereto, the Guarantors party thereto, Adams Street Credit Advisors, LP, as Administrative Agent and as Collateral Agent and each lender party thereto (incorporated by reference to Exhibit 10.1 to the Current Report on Form 8-K filed by the registrant on August 29, 2024). | | | | | | |
10.26 | | Voting Agreement, dated January 20, 2025, by and among Redwire Corporation, AE Red Holdings, LLC, AE Industrial Partners Fund II GP, LP, AeroEquity GP, LLC, AE Industrial Partners Fund II, LP, AE Industrial Partners Fund II-A, LP, AE Industrial Partners Fund II-B, LP, AE Industrial Partners Structured Solutions I, L.P., AE Industrial Partners Structured Solutions I GP, L.P. (incorporated by reference to Exhibit 99.1 to the Current Report on Form 8-K filed by the registrant on January 21, 2025). | | | | | | |
10.27 | | | | | | | | |
10.28 | | | | | | | | |
10.29 | | | | | | | | |
10.30 | | Credit Agreement, dated June 13, 2025, by and among Redwire Intermediate Edge Holdings, LLC, Edge Autonomy Intermediate II Holdings, LLC, Edge Autonomy Holdings, LLC, Edge Autonomy Operations, LLC, Edge Autonomy, LLC, Edge Autonomy SLO, LLC, Edge Autonomy Bend, LLC, Edge Autonomy Energy Systems, LLC, Edge Autonomy Huntsville, LLC, JPMorgan Chase Bank, N.A., as administrative agent and collateral agent and the lenders party thereto from time to time. (incorporated by reference to Exhibit 10.1 to the Current Report on Form 8-K filed by the Registrant on June 13, 2025). | | | | | | |
10.31 | | Tenth Amendment to Credit Agreement, dated as of June 4, 2025, by and among Redwire Holdings, LLC, the other Borrowers party thereto, the Guarantors party thereto, Adams Street Credit Advisors, LP, as Administrative Agent and as Collateral Agent and each lender party thereto (incorporated by reference to Exhibit 10.2 to the Quarterly Report on Form 10-Q filed by the Registrant on August 7, 2025). | | | | | | |
10.32 | | | | | | | | |
10.33 | | | | | | | | |
10.34+ | | | | | | | | |
10.35+ | | | | | | | | |
10.36 | | Equity Distribution Agreement, dated as of November 10, 2025, by and between Redwire Corporation, Truist Securities, Inc., J.P. Morgan Securities LLC, BofA Securities, Inc. and TCBI Securities, Inc., doing business as Texas Capital Securities (incorporated by reference to Exhibit 1.1 to the Current Report on Form 8-K filed by the registrant on November 10, 2025). | | | | | | |
10.37 | | Amended and Restated Credit Agreement, dated as of February 20, 2026, by and among Redwire Defense Tech Intermediate Holdings, LLC, as the Parent, Redwire Defense Tech Intermediate II Holdings, LLC, as the Lead Borrower, the other borrowers party thereto from time to time, the other guarantors party thereto from time to time, JPMorgan Chase Bank, N.A., as Administrative Agent and Collateral Agent, and the Lenders party thereto from time to time (incorporated by reference to Exhibit 10.1 to the Current Report on Form 8-K filed by the registrant on February 25, 2026). | | | | | | |
19 | | | | | | | | |
| 21 | | | | | | | | |
| | | | | | | | | | | | |
| | | | | |
Exhibit
Number | | Description | | | | | | |
| 23.1 | | | | | | | | |
| | | | | | | | |
| 31.1 | | | | | | | | |
| 31.2 | | | | | | | | |
| 32.1* | | | | | | | | |
| 32.2* | | | | | | | | |
97+ | | | | | | | | |
| 101.SCH | | Inline XBRL Taxonomy Extension Schema Document | | | | | | |
| 101.CAL | | Inline XBRL Taxonomy Extension Calculation Linkbase Document | | | | | | |
| 101.DEF | | Inline XBRL Taxonomy Extension Definition Linkbase Document | | | | | | |
| 101.LAB | | Inline XBRL Taxonomy Extension Label Linkbase Document | | | | | | |
| 101.PRE | | Inline XBRL Taxonomy Extension Presentation Linkbase Document | | | | | | |
| 104 | | Cover Page Interactive Data File (formatted as inline XBRL and contained in Exhibit 101) | | | | | | |
†Schedules and exhibits to this Exhibit omitted pursuant to Regulation S-K Item 601(b)(2). The Registrant agrees to furnish supplementally a copy of any omitted schedule of exhibit to the SEC upon request.
+ Management or compensatory agreement or arrangement.
* The certifications furnished in Exhibit 32.1 and Exhibit 32.2 hereto are deemed to accompany this Annual Report on Form 10-K and will not be deemed “filed” for purposes of Section 18 of the Securities Exchange Act of 1934, as amended, except to the extent that the registrant specifically incorporates it by reference.
Item 16. Form 10-K Summary
None.
SIGNATURES
Pursuant to the requirements of the Securities Exchange Act of 1934, the Registrant has duly caused this report to be signed on its behalf by the undersigned, thereunto duly authorized.
| | | | | | | | | | | | | | |
| | | Redwire Corporation |
| | | | |
| Date: | February 27, 2026 | | By: | /s/ Peter Cannito |
| | | Name: | Peter Cannito |
| | | Title: | Chief Executive Officer and Chairman |
| | | | (Principal Executive Officer) |
| | | | |
| | | | |
| | | | |
| | | | |
| | | | |
POWER OF ATTORNEY
KNOW ALL PERSONS BY THESE PRESENT that the undersigned officers and directors of Redwire Corporation do hereby constitute and appoint Peter Cannito and Chris Edmunds, and each of them, as his or her true and lawful attorneys-in-fact and agents, with full power of substitution and resubstitution, for him or her and in his or her name, place and stead, in any and all capacities, to sign any and all amendments to this Annual Report on Form 10-K, and to file the same, with all exhibits thereto, and other documents in connection therewith, with the Securities and Exchange Commission, granting unto said attorneys-in-fact and agents, and each of them, full power and authority to do and perform each and every act and thing requisite and necessary to be done in connection therewith, as fully to all intents and purposes as he or she might or could do in person, hereby ratifying and confirming that all said attorneys-in-fact and agents, or any of them or their or his or her substitute or substitutes, may lawfully do or cause to be done by virtue hereof.
Pursuant to the requirements of the Securities Exchange Act of 1934, this Report has been signed by the following persons on behalf of the Registrant and in the capacities and on the dates indicated:
| | | | | | | | | | | | | | |
| Signature | | Title | | Date |
| /s/ Peter Cannito | | Chief Executive Officer and Chairman (Principal Executive Officer) | | February 27, 2026 |
| Peter Cannito | | | | |
| | | | |
| /s/ Chris Edmunds | | Chief Financial Officer (Principal Financial and Accounting Officer) | | February 27, 2026 |
| Chris Edmunds | | | | |
| | | | |
| | | | |
| | | | |
| | | | |
| | | | |
| | | | |
| | | | |
| /s/ Louis R. Brothers | | Director | | February 27, 2026 |
| Louis R. Brothers | | | | |
| | | | |
/s/ Michael Greene | | Director | | February 27, 2026 |
Michael Greene | | | | |
| | | | |
/s/ Dorothy D. Hayes | | Director | | February 27, 2026 |
Dorothy D. Hayes | | | | |
| | | | |
/s/ Joanne Isham | | Director | | February 27, 2026 |
Joanne Isham | | | | |
| | | | |
| /s/ Kirk Konert | | Director | | February 27, 2026 |
| Kirk Konert | | | | |
| | | | |
| /s/ David Kornblatt | | Director | | February 27, 2026 |
| David Kornblatt | | | | |
| | | | |
/s/ Gen (RET) James McConville | | Director | | February 27, 2026 |
Gen (RET) James McConville | | | | |
| | | | |
| | | | |
| | | | |