
1. Insert Footnote October 3, 2022 Accelerating Profitable Growth in the Global Space Sector with the Acquisition of QinetiQ Space NV Exhibit 99.2
1. Insert Footnote Disclaimers 2 The presentation (the “Presentation”) includes information regarding the proposed transaction between Redwire Corporation (“Redwire” or the “Company”) and QinetiQ Space NV (“Space NV”), whereby Redwire intends to acquire all of the issued share capital of the Space NV (the “Transaction”). Industry and market data used in this Presentation have been obtained from third-party industry publications and sources as well as from research reports prepared for other purposes. Redwire has not independently verified the data obtained from these sources and cannot assure you of the data’s accuracy or completeness. This data is subject to change. Recipients of this Presentation are not to construe its contents, or any prior or subsequent communications from or with Redwire or its representatives as investment, legal or tax advice. In addition, this Presentation does not purport to be all-inclusive or to contain all of the information that may be required to make a full analysis of Redwire, Space NV or the Transaction. Recipients of this Presentation should each make their own evaluation of Redwire, Space NV and the Transaction and of the relevance and adequacy of the information and should make such other investigations as they deem necessary. Statements other than historical facts about Redwire, including but not limited to those concerning market conditions or trends, consumer or customer preferences or other similar concepts with respect to Redwire and/or Space NV, are based on current expectations, estimates, projections, targets, opinions and/or beliefs of Redwire, or, when applicable, of one or more third-party sources. In addition, financial information related to Space NV is based on data available to Redwire, has not been audited by Redwire or its auditors, and is subject to change. Such statements involve known and unknown risks, uncertainties and other factors, and undue reliance should not be placed thereon. In addition, no representation or warranty is made with respect to the reasonableness of any estimates, forecasts, illustrations, prospects or returns, which should be regarded as illustrative only, or that any profits will be realized. Forward-Looking Statements Readers are cautioned that the statements contained in this Presentation regarding expectations of our performance or other matters that may affect our business, results of operations, or financial condition are “forward looking statements” as defined by the “safe harbor” provisions in the Private Securities Litigation Reform Act of 1995. Such statements are made in reliance on the safe harbor provisions of Section 27A of the Securities Act of 1933 and Section 21E of the Securities Exchange Act of 1934. All statements, other than statements of historical fact, included or incorporated in this Presentation, including statements regarding our strategy, financial position, guidance, funding for continued operations, cash reserves, liquidity, projected costs, plans, projects, awards and contracts, and objectives of management, are forward looking statements. Words such as “expect,” “anticipate,” “should,” “believe,” “hope,” “target,” “continued,” “project,” “plan,” “goals,” “opportunity,” “appeal,” “estimate,” “potential,” “predict,” “may,” “will,” “might,” “could,” “intend,” “shall,” “possible,” “would,” “approximately,” “likely,” “schedule,” and variations of these terms or the negative of these terms and similar expressions are intended to identify these forward-looking statements, but the absence of these words does not mean that a statement is not forward looking. These forward-looking statements are not guarantees of future performance, conditions or results. Forward looking statements are subject to a number of risks and uncertainties, many of which involve factors or circumstances that are beyond our control. These factors and circumstances include, but are not limited to: (1) the company’s limited operating history; (2) the development and continued refinement of many of the company’s proprietary technologies, produces and service offerings; (3) the possibility that the company’s assumptions relating to future results may prove incorrect; (4) the inability to successfully integrate recently completed and future acquisitions; (5) the possibility that the company may be adversely affected by other macroeconomic, business, and/or competitive factors; (6) the impacts of COVID-19 on the company’s business; (7) unsatisfactory performance of our products; (8) the emerging nature of the market for in-space infrastructure services; (9) inability to realize benefits from new offerings or the application of our technologies; (10) the inability to convert orders in backlog into revenue; (11) data breaches or incidents involving the company’s technology; (12) the company’s dependence on senior management and other highly skilled personnel; (13) incurrence of significant expenses and capital expenditures to execute our business plan; (14) the ability to recognize the anticipated benefits of the business combination Genesis Park Acquisition Corp., which may be affected by, among other things, competition, the ability of the combined company to grow and manage growth profitably, maintain relationships with customers and suppliers and retain its management and key employees; (15) costs related to the business combination with Genesis Park Acquisition Corp.; (16) early termination, audits, investigations, sanctions and penalties with respect to government contracts; (17) inability to report our financial condition or results of operations accurately or timely as a result of identified material weaknesses; (18) inability to meet or maintain stock exchange listing standards; (19) the need for substantial additional funding to finance our operations, which may not be available when we need it, on acceptable terms or at all; (20) significant fluctuation of our operating results; (21) adverse publicity stemming from any incident involving the Company or its competitors; (22) changes in applicable laws or regulations; (23) risks related to the Transaction; and (24) other risks and uncertainties described in our most recent Annual Report on Form 10-K and Quarterly Reports on Form 10-Q and those indicated from time to time in other documents filed or to be filed with the SEC by the Company. The forward-looking statements contained in this Presentation are based on our current expectations and beliefs concerning future developments and their potential effects on us. If underlying assumptions to forward looking statements prove inaccurate, or if known or unknown risks or uncertainties materialize, actual results could vary materially from those anticipated, estimated, or projected. The forward-looking statements contained in this press release are made as of the date of this press release, and the Company disclaims any intention or obligation, other than imposed by law, to update or revise any forward-looking statements, whether as a result of new information, future events, or otherwise. Persons reading this press release are cautioned not to place undue reliance on forward looking statements.
1. Insert Footnote Disclaimers 3 No Offer or Solicitation This Presentation is for informational purposes only and is neither an offer to sell or purchase, nor a solicitation of an offer to sell, buy or subscribe for any securities, nor shall there be any sale, issuance or transfer or securities in any jurisdiction in contravention of applicable law. This Presentation does not constitute either advice or a recommendation regarding any securities. Any offer to sell securities will be made only pursuant to a definitive agreement and will be made in reliance on an exemption from registration under the Securities Act of 1933, as amended, for offers and sales of securities that do not involve a public offering. Trademarks This Presentation contains trademarks, service marks, tradenames and copyrights of Redwire and other companies, which are the property of their respective owners. The use herein does not imply an affiliation with, or endorsement by, the owners of these service marks, trademarks and tradenames. Third-party logos herein may represent past customers, present customers or may be provided simply for illustrative purposes only. Inclusion of such logos does not necessarily imply affiliation with or endorsement by such firms or businesses. There is no guarantee that Redwire will work, or continue to work, with any of the firms or businesses whose logos are included herein in the future. Additional Information and Where to Find It If a definitive agreement is entered into in connection with the Transaction described herein, a full description of the terms of the Transaction will be provided in a Current Report on Form 8-K to be filed with the SEC. This Presentation does not contain all the information that should be considered concerning the Transaction and is not intended to form the basis of any investment decision or any other decision in respect of the Transaction. Redwire urges investors, shareholders and other interested persons to read Redwire’s filings with the SEC, because these documents may contain important information about Redwire, Space NV and the Transaction. Non-GAAP Financial Information This Presentation contains financial measures that have not been prepared in accordance with United States Generally Accepted Accounting Principles (“U.S. GAAP”). These financial measures include Adjusted EBITDA, Pro Forma Adjusted EBITDA and Free Cash Flow. We use Adjusted EBITDA and Pro Forma Adjusted EBITDA to evaluate our operating performance, generate future operating plans, and make strategic decisions, including those relating to operating expenses and the allocation of internal resources. We use Free Cash Flow as a useful indicator of liquidity to evaluate our period-over-period operating cash generation that will be used to service our debt, and can be used to invest in future growth through new business development activities and/or acquisitions, among other uses. Free Cash Flow does not represent the total increase or decrease in our cash balance, and it should not be inferred that the entire amount of free cash flow is available for discretionary expenditures, since we have mandatory debt service requirements and other non-discretionary expenditures that are not deducted from this measure. These Non-GAAP financial measures are used to supplement the financial information presented on a U.S. GAAP basis and should not be considered in isolation or as a substitute for the relevant U.S. GAAP measures and should be read in conjunction with information presented on a U.S. GAAP basis. Because not all companies use identical calculations, our presentation of Non-GAAP measures may not be comparable to other similarly titled measures of other companies. Adjusted EBITDA is defined as net income (loss) adjusted for interest expense (income), net, income tax (benefit) expense, depreciation and amortization, impairment expense, acquisition deal costs, acquisition integration costs, acquisition earnout costs, purchase accounting fair value adjustment related to deferred revenue, severance costs, capital market and advisory fees, write-off of long-lived assets, equity-based compensation, committed equity facility transaction costs, and warrant liability fair value adjustments. Pro Forma Adjusted EBITDA is defined as Adjusted EBITDA further adjusted for the incremental Adjusted EBITDA that acquired businesses would have contributed for the periods presented if such acquisitions had occurred on January 1 of the year in which they occurred. Accordingly, historical financial information for the businesses acquired includes pro forma adjustments calculated in a manner consistent with the concepts of Article 8 of Regulation S-X, which are ultimately added back in the calculation of Adjusted EBITDA. As an emerging growth company that has completed a significant number of acquisitions in 2020 and 2021, we believe Pro Forma Adjusted EBITDA provides meaningful insights into the impact of strategic acquisitions as well as an indicative run rate of the Company’s future operating performance. Free Cash Flow is computed as net cash provided by (used in) operating activities less capital expenditures.
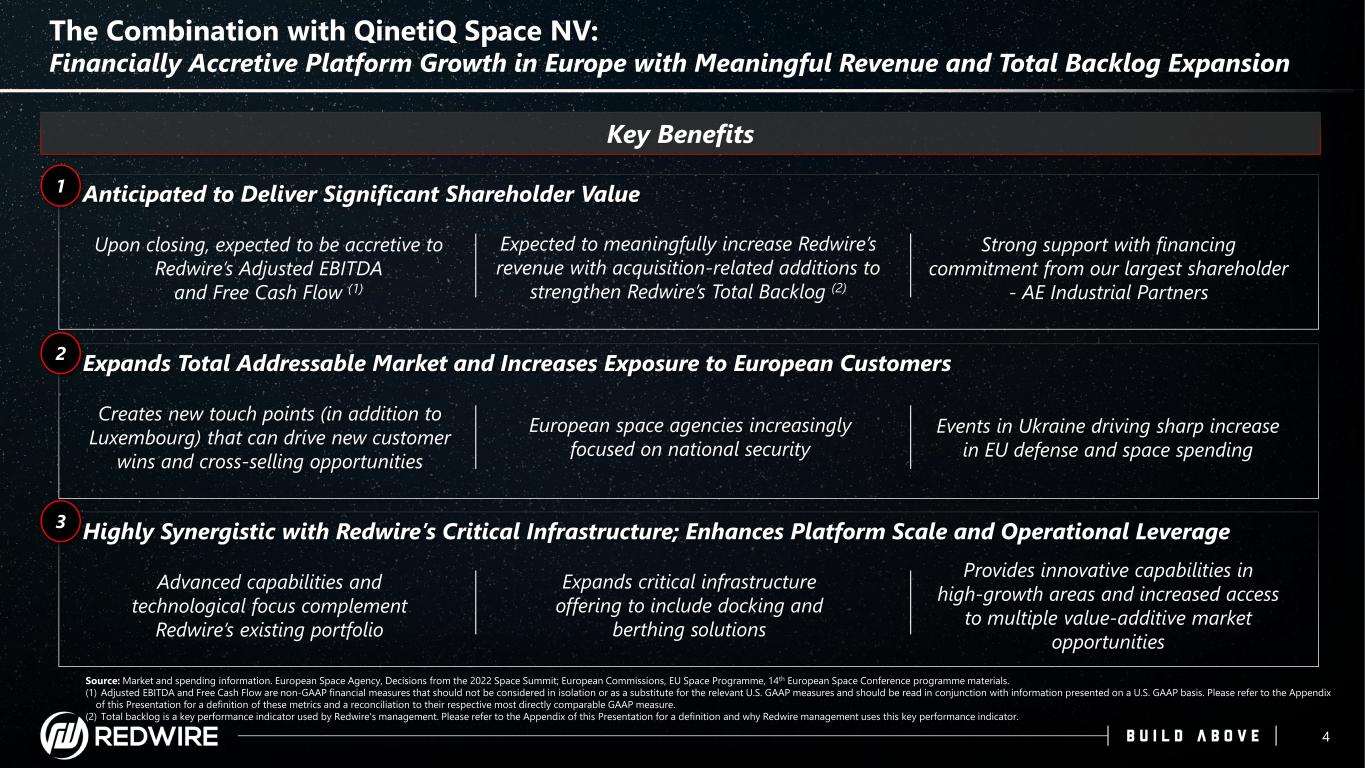
1. Insert Footnote Advanced capabilities and technological focus complement Redwire’s existing portfolio Upon closing, expected to be accretive to Redwire’s Adjusted EBITDA and Free Cash Flow (1) Expands critical infrastructure offering to include docking and berthing solutions Expected to meaningfully increase Redwire’s revenue with acquisition-related additions to strengthen Redwire’s Total Backlog (2) Provides innovative capabilities in high-growth areas and increased access to multiple value-additive market opportunities Strong support with financing commitment from our largest shareholder - AE Industrial Partners European space agencies increasingly focused on national security Creates new touch points (in addition to Luxembourg) that can drive new customer wins and cross-selling opportunities Events in Ukraine driving sharp increase in EU defense and space spending The Combination with QinetiQ Space NV: Financially Accretive Platform Growth in Europe with Meaningful Revenue and Total Backlog Expansion 4 Key Benefits Anticipated to Deliver Significant Shareholder Value Highly Synergistic with Redwire’s Critical Infrastructure; Enhances Platform Scale and Operational Leverage 1 3 Expands Total Addressable Market and Increases Exposure to European Customers2 Source: Market and spending information. European Space Agency, Decisions from the 2022 Space Summit; European Commissions, EU Space Programme, 14th European Space Conference programme materials. (1) Adjusted EBITDA and Free Cash Flow are non-GAAP financial measures that should not be considered in isolation or as a substitute for the relevant U.S. GAAP measures and should be read in conjunction with information presented on a U.S. GAAP basis. Please refer to the Appendix of this Presentation for a definition of these metrics and a reconciliation to their respective most directly comparable GAAP measure. (2) Total backlog is a key performance indicator used by Redwire's management. Please refer to the Appendix of this Presentation for a definition and why Redwire management uses this key performance indicator.
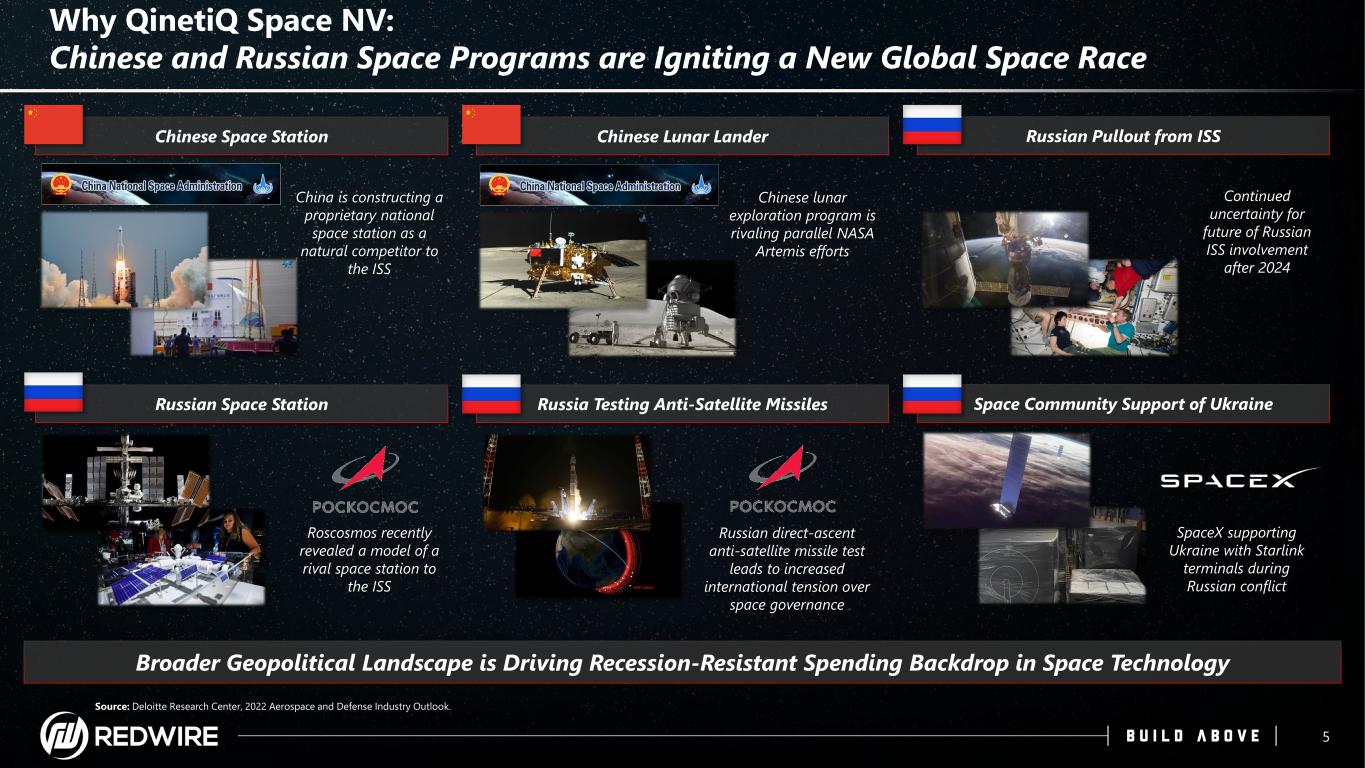
1. Insert Footnote Why QinetiQ Space NV: Chinese and Russian Space Programs are Igniting a New Global Space Race 5 Chinese Space Station Chinese Lunar Lander Russian Pullout from ISS Russian Space Station Russia Testing Anti-Satellite Missiles Space Community Support of Ukraine Broader Geopolitical Landscape is Driving Recession-Resistant Spending Backdrop in Space Technology China is constructing a proprietary national space station as a natural competitor to the ISS Chinese lunar exploration program is rivaling parallel NASA Artemis efforts Continued uncertainty for future of Russian ISS involvement after 2024 Roscosmos recently revealed a model of a rival space station to the ISS SpaceX supporting Ukraine with Starlink terminals during Russian conflict Russian direct-ascent anti-satellite missile test leads to increased international tension over space governance Source: Deloitte Research Center, 2022 Aerospace and Defense Industry Outlook.
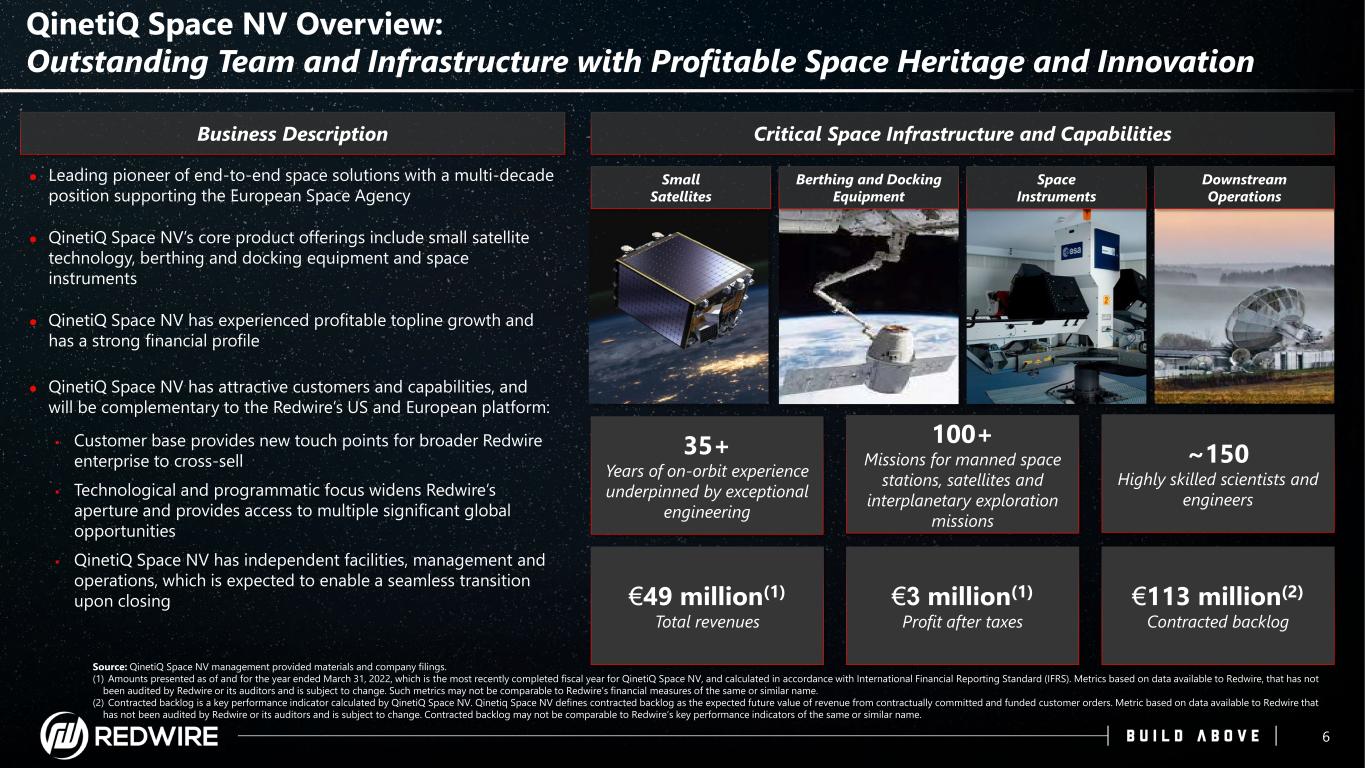
1. Insert Footnote QinetiQ Space NV Overview: Outstanding Team and Infrastructure with Profitable Space Heritage and Innovation 6 Business Description Leading pioneer of end-to-end space solutions with a multi-decade position supporting the European Space Agency QinetiQ Space NV’s core product offerings include small satellite technology, berthing and docking equipment and space instruments QinetiQ Space NV has experienced profitable topline growth and has a strong financial profile QinetiQ Space NV has attractive customers and capabilities, and will be complementary to the Redwire’s US and European platform: Customer base provides new touch points for broader Redwire enterprise to cross-sell Technological and programmatic focus widens Redwire’s aperture and provides access to multiple significant global opportunities QinetiQ Space NV has independent facilities, management and operations, which is expected to enable a seamless transition upon closing 35+ Years of on-orbit experience underpinned by exceptional engineering 100+ Missions for manned space stations, satellites and interplanetary exploration missions €49 million(1) Total revenues ~150 Highly skilled scientists and engineers Critical Space Infrastructure and Capabilities Small Satellites Berthing and Docking Equipment Space Instruments Downstream Operations €3 million(1) Profit after taxes €113 million(2) Contracted backlog Source: QinetiQ Space NV management provided materials and company filings. (1) Amounts presented as of and for the year ended March 31, 2022, which is the most recently completed fiscal year for QinetiQ Space NV, and calculated in accordance with International Financial Reporting Standard (IFRS). Metrics based on data available to Redwire, that has not been audited by Redwire or its auditors and is subject to change. Such metrics may not be comparable to Redwire’s financial measures of the same or similar name. (2) Contracted backlog is a key performance indicator calculated by QinetiQ Space NV. Qinetiq Space NV defines contracted backlog as the expected future value of revenue from contractually committed and funded customer orders. Metric based on data available to Redwire that has not been audited by Redwire or its auditors and is subject to change. Contracted backlog may not be comparable to Redwire’s key performance indicators of the same or similar name.
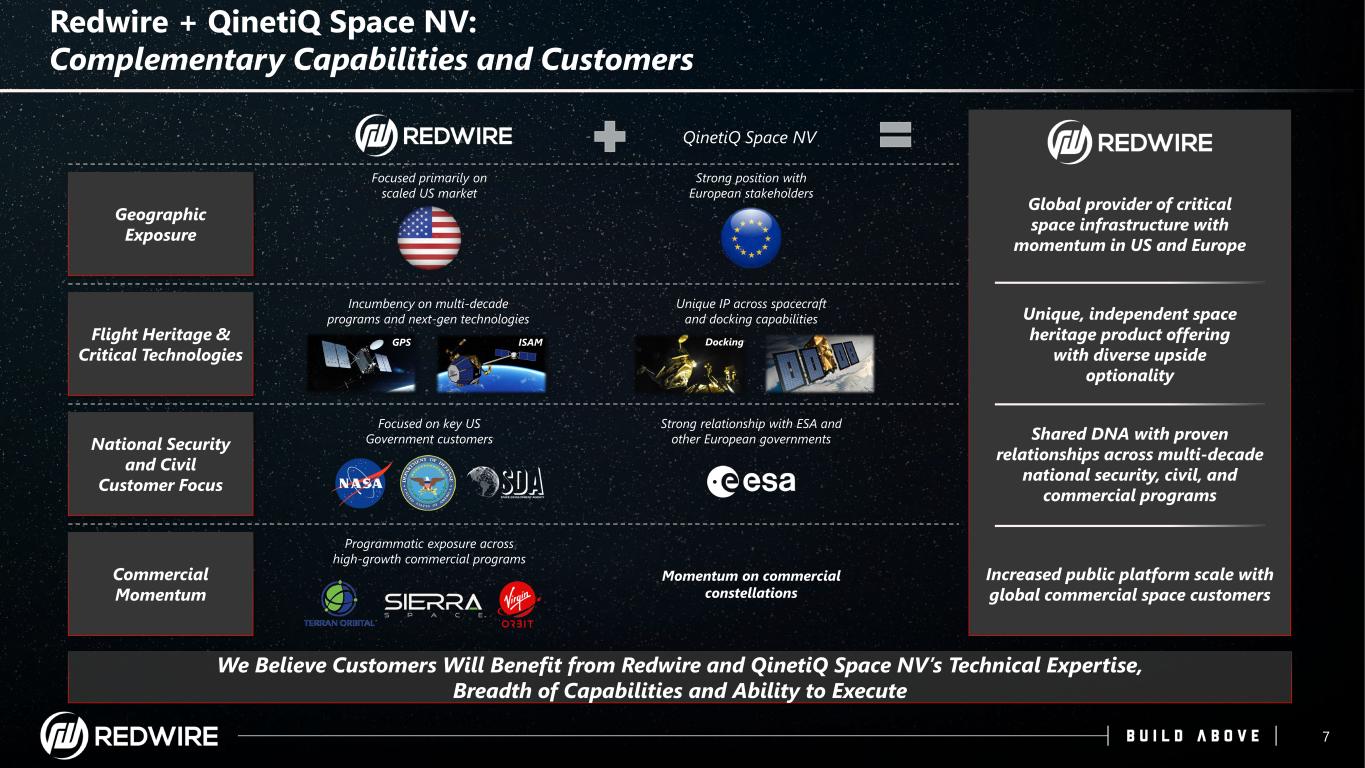
1. Insert Footnote Redwire + QinetiQ Space NV: Complementary Capabilities and Customers 7 Geographic Exposure Flight Heritage & Critical Technologies QinetiQ Space NV National Security and Civil Customer Focus Commercial Momentum We Believe Customers Will Benefit from Redwire and QinetiQ Space NV’s Technical Expertise, Breadth of Capabilities and Ability to Execute Focused primarily on scaled US market Strong position with European stakeholders Global provider of critical space infrastructure with momentum in US and Europe Unique, independent space heritage product offering with diverse upside optionality Shared DNA with proven relationships across multi-decade national security, civil, and commercial programs Increased public platform scale with global commercial space customers Incumbency on multi-decade programs and next-gen technologies Unique IP across spacecraft and docking capabilities Focused on key US Government customers Strong relationship with ESA and other European governments Programmatic exposure across high-growth commercial programs Momentum on commercial constellations GPS ISAM Docking
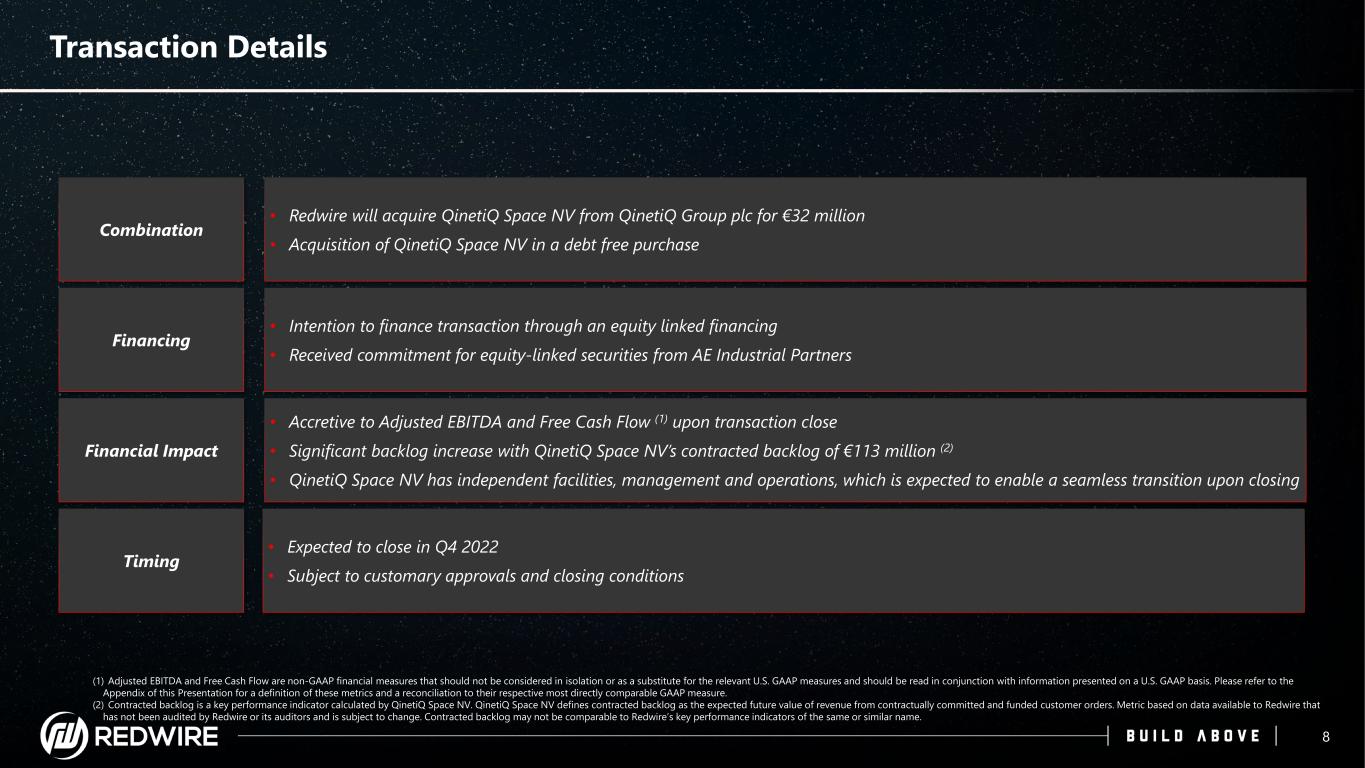
1. Insert Footnote Transaction Details 8 Combination Financing Financial Impact Timing • Redwire will acquire QinetiQ Space NV from QinetiQ Group plc for €32 million • Acquisition of QinetiQ Space NV in a debt free purchase • Intention to finance transaction through an equity linked financing • Received commitment for equity-linked securities from AE Industrial Partners • Accretive to Adjusted EBITDA and Free Cash Flow (1) upon transaction close • Significant backlog increase with QinetiQ Space NV’s contracted backlog of €113 million (2) • QinetiQ Space NV has independent facilities, management and operations, which is expected to enable a seamless transition upon closing • Expected to close in Q4 2022 • Subject to customary approvals and closing conditions (1) Adjusted EBITDA and Free Cash Flow are non-GAAP financial measures that should not be considered in isolation or as a substitute for the relevant U.S. GAAP measures and should be read in conjunction with information presented on a U.S. GAAP basis. Please refer to the Appendix of this Presentation for a definition of these metrics and a reconciliation to their respective most directly comparable GAAP measure. (2) Contracted backlog is a key performance indicator calculated by QinetiQ Space NV. QinetiQ Space NV defines contracted backlog as the expected future value of revenue from contractually committed and funded customer orders. Metric based on data available to Redwire that has not been audited by Redwire or its auditors and is subject to change. Contracted backlog may not be comparable to Redwire’s key performance indicators of the same or similar name.
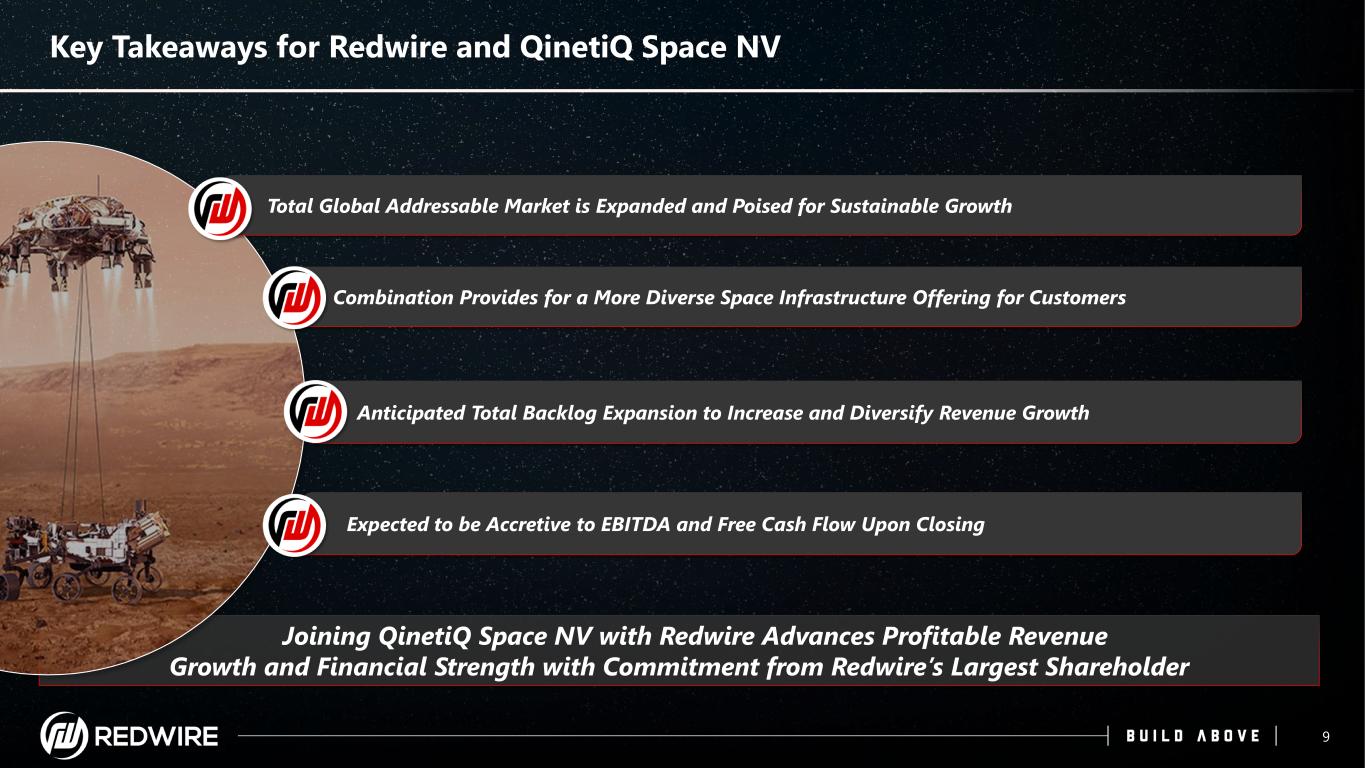
1. Insert Footnote Joining QinetiQ Space NV with Redwire Advances Profitable Revenue Growth and Financial Strength with Commitment from Redwire’s Largest Shareholder Anticipated Total Backlog Expansion to Increase and Diversify Revenue Growth Key Takeaways for Redwire and QinetiQ Space NV Combination Provides for a More Diverse Space Infrastructure Offering for Customers Total Global Addressable Market is Expanded and Poised for Sustainable Growth Expected to be Accretive to EBITDA and Free Cash Flow Upon Closing 9
1. Insert Footnote Appendix Redwire By The Numbers
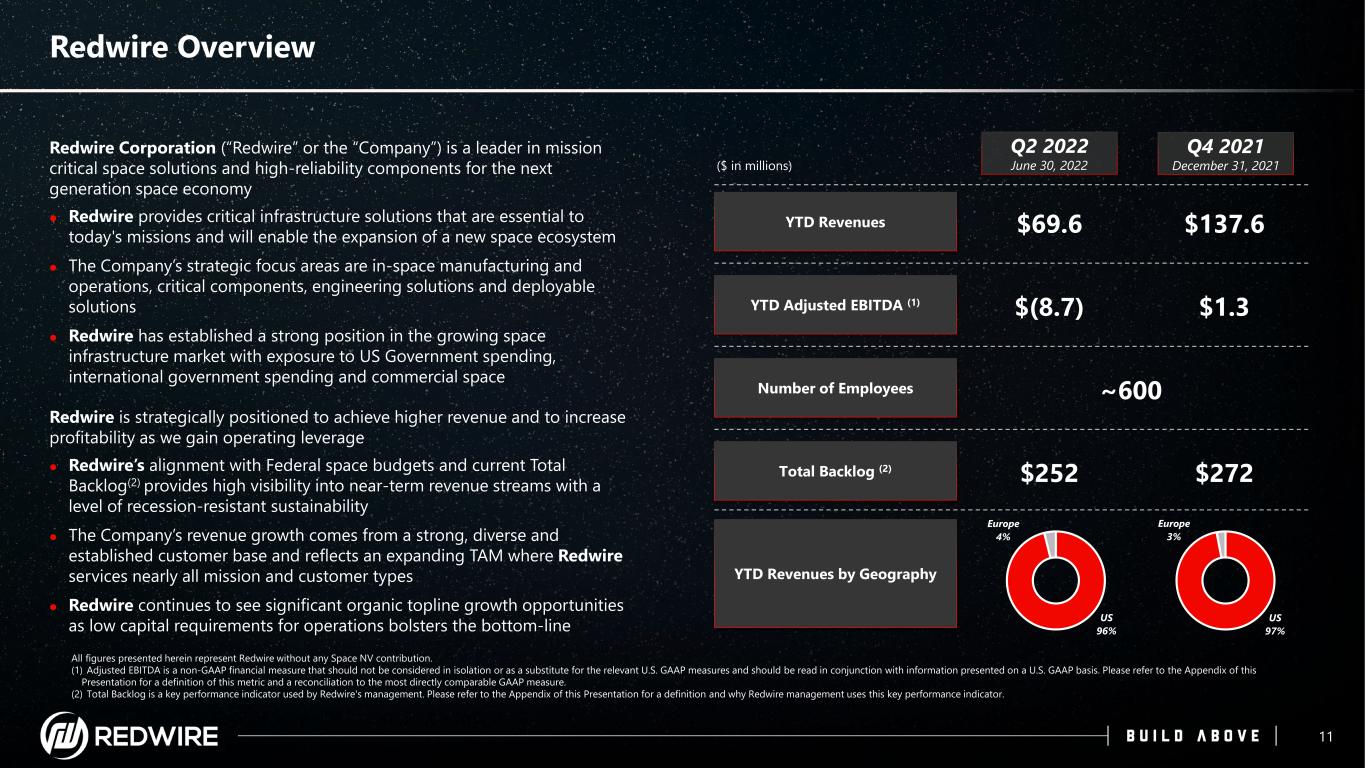
1. Insert Footnote Redwire Overview 11 YTD Revenues $69.6 Total Backlog (2) $252 YTD Adjusted EBITDA (1) $(8.7) All figures presented herein represent Redwire without any Space NV contribution. (1) Adjusted EBITDA is a non-GAAP financial measure that should not be considered in isolation or as a substitute for the relevant U.S. GAAP measures and should be read in conjunction with information presented on a U.S. GAAP basis. Please refer to the Appendix of this Presentation for a definition of this metric and a reconciliation to the most directly comparable GAAP measure. (2) Total Backlog is a key performance indicator used by Redwire's management. Please refer to the Appendix of this Presentation for a definition and why Redwire management uses this key performance indicator. Number of Employees ~600 YTD Revenues by Geography US 96% Europe 4% ($ in millions) Redwire Corporation (“Redwire” or the “Company”) is a leader in mission critical space solutions and high-reliability components for the next generation space economy Redwire provides critical infrastructure solutions that are essential to today's missions and will enable the expansion of a new space ecosystem The Company’s strategic focus areas are in-space manufacturing and operations, critical components, engineering solutions and deployable solutions Redwire has established a strong position in the growing space infrastructure market with exposure to US Government spending, international government spending and commercial space Redwire is strategically positioned to achieve higher revenue and to increase profitability as we gain operating leverage Redwire’s alignment with Federal space budgets and current Total Backlog(2) provides high visibility into near-term revenue streams with a level of recession-resistant sustainability The Company’s revenue growth comes from a strong, diverse and established customer base and reflects an expanding TAM where Redwire services nearly all mission and customer types Redwire continues to see significant organic topline growth opportunities as low capital requirements for operations bolsters the bottom-line Q2 2022 June 30, 2022 Q4 2021 December 31, 2021 $137.6 $272 $1.3 US 97% Europe 3%
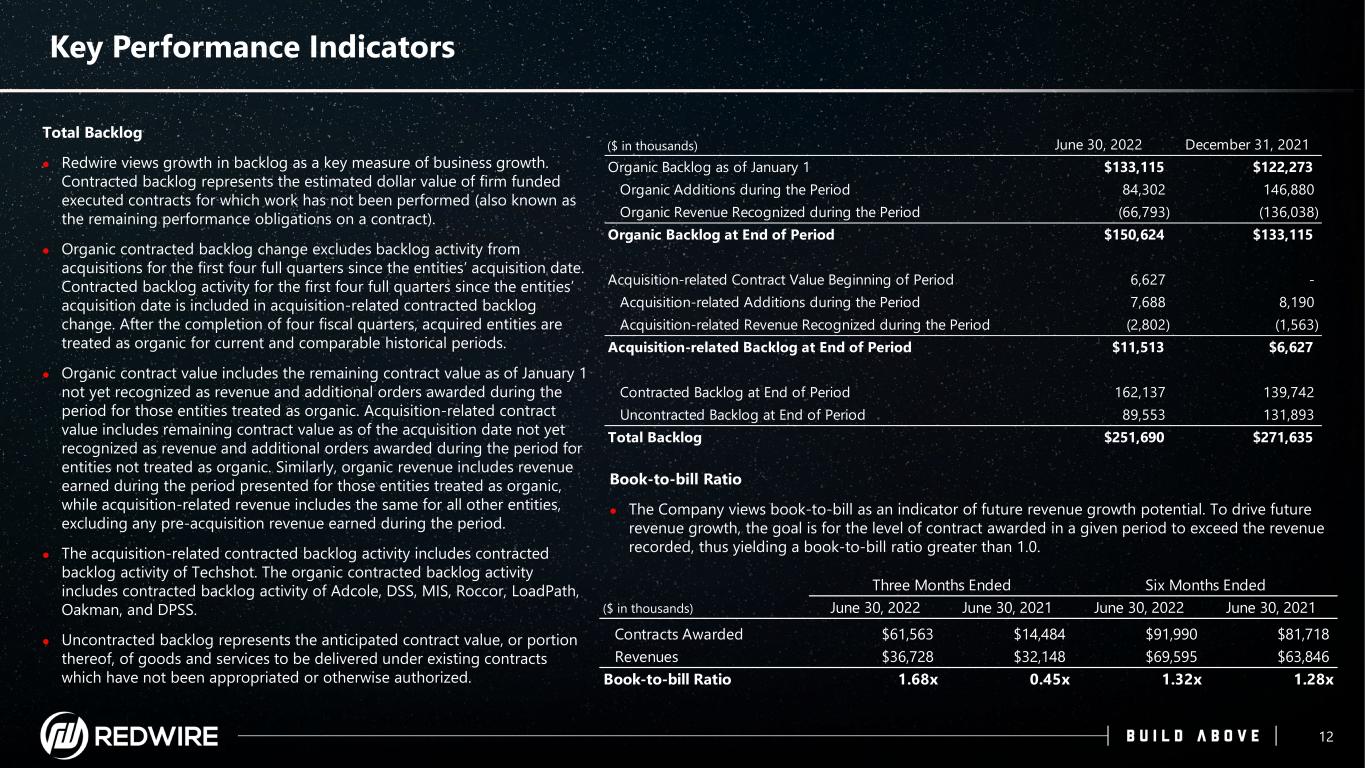
1. Insert Footnote Key Performance Indicators 12 Total Backlog Redwire views growth in backlog as a key measure of business growth. Contracted backlog represents the estimated dollar value of firm funded executed contracts for which work has not been performed (also known as the remaining performance obligations on a contract). Organic contracted backlog change excludes backlog activity from acquisitions for the first four full quarters since the entities’ acquisition date. Contracted backlog activity for the first four full quarters since the entities’ acquisition date is included in acquisition-related contracted backlog change. After the completion of four fiscal quarters, acquired entities are treated as organic for current and comparable historical periods. Organic contract value includes the remaining contract value as of January 1 not yet recognized as revenue and additional orders awarded during the period for those entities treated as organic. Acquisition-related contract value includes remaining contract value as of the acquisition date not yet recognized as revenue and additional orders awarded during the period for entities not treated as organic. Similarly, organic revenue includes revenue earned during the period presented for those entities treated as organic, while acquisition-related revenue includes the same for all other entities, excluding any pre-acquisition revenue earned during the period. The acquisition-related contracted backlog activity includes contracted backlog activity of Techshot. The organic contracted backlog activity includes contracted backlog activity of Adcole, DSS, MIS, Roccor, LoadPath, Oakman, and DPSS. Uncontracted backlog represents the anticipated contract value, or portion thereof, of goods and services to be delivered under existing contracts which have not been appropriated or otherwise authorized. Book-to-bill Ratio The Company views book-to-bill as an indicator of future revenue growth potential. To drive future revenue growth, the goal is for the level of contract awarded in a given period to exceed the revenue recorded, thus yielding a book-to-bill ratio greater than 1.0. ($ in thousands) Three Months Ended Six Months Ended June 30, 2022 June 30, 2021 June 30, 2022 June 30, 2021 Contracts Awarded $61,563 $14,484 $91,990 $81,718 Revenues $36,728 $32,148 $69,595 $63,846 Book-to-bill Ratio 1.68x 0.45x 1.32x 1.28x ($ in thousands) June 30, 2022 December 31, 2021 Organic Backlog as of January 1 $133,115 $122,273 Organic Additions during the Period 84,302 146,880 Organic Revenue Recognized during the Period (66,793) (136,038) Organic Backlog at End of Period $150,624 $133,115 Acquisition-related Contract Value Beginning of Period 6,627 - Acquisition-related Additions during the Period 7,688 8,190 Acquisition-related Revenue Recognized during the Period (2,802) (1,563) Acquisition-related Backlog at End of Period $11,513 $6,627 Contracted Backlog at End of Period 162,137 139,742 Uncontracted Backlog at End of Period 89,553 131,893 Total Backlog $251,690 $271,635
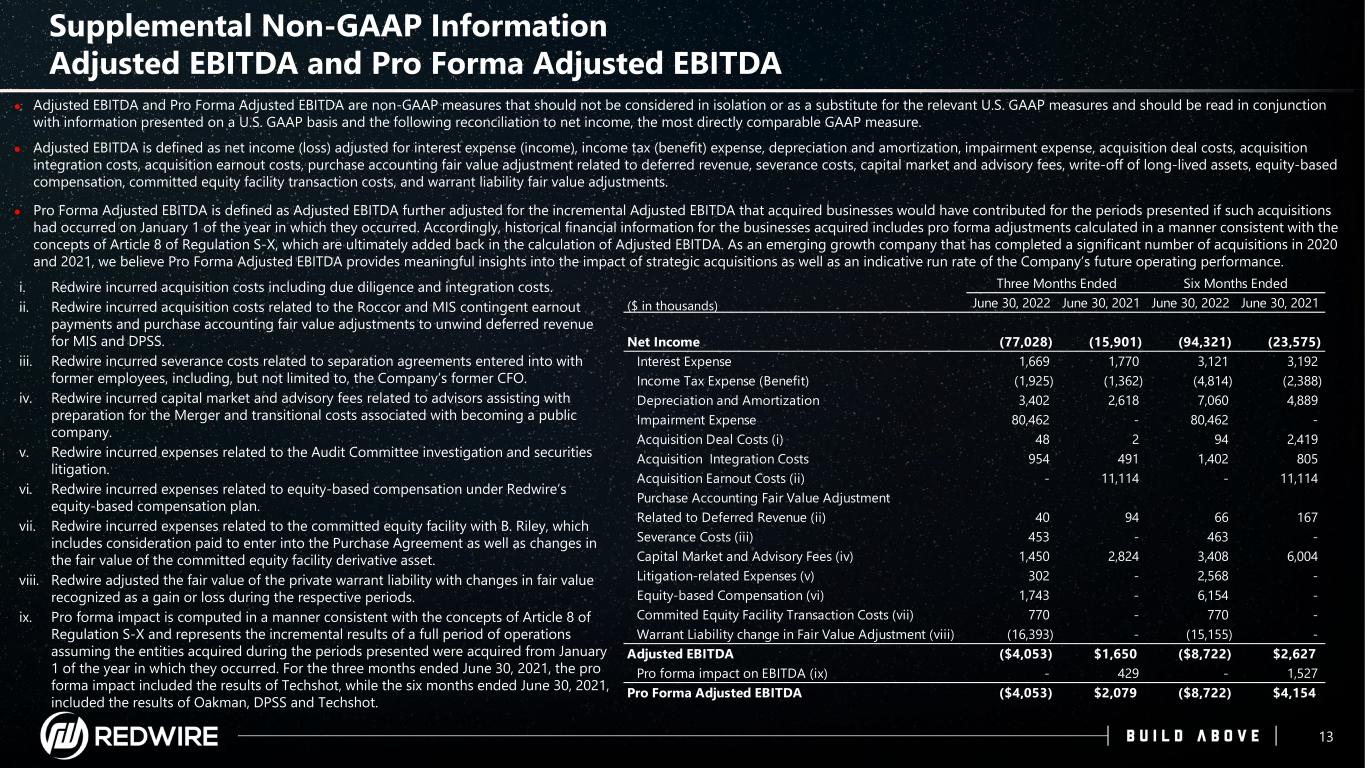
1. Insert Footnote Three Months Ended Six Months Ended June 30, 2022 June 30, 2021 June 30, 2022 June 30, 2021 Net Income (77,028) (15,901) (94,321) (23,575) Interest Expense 1,669 1,770 3,121 3,192 Income Tax Expense (Benefit) (1,925) (1,362) (4,814) (2,388) Depreciation and Amortization 3,402 2,618 7,060 4,889 Impairment Expense 80,462 - 80,462 - Acquisition Deal Costs (i) 48 2 94 2,419 Acquisition Integration Costs 954 491 1,402 805 Acquisition Earnout Costs (ii) - 11,114 - 11,114 Purchase Accounting Fair Value Adjustment Related to Deferred Revenue (ii) 40 94 66 167 Severance Costs (iii) 453 - 463 - Capital Market and Advisory Fees (iv) 1,450 2,824 3,408 6,004 Litigation-related Expenses (v) 302 - 2,568 - Equity-based Compensation (vi) 1,743 - 6,154 - Commited Equity Facility Transaction Costs (vii) 770 - 770 - Warrant Liability change in Fair Value Adjustment (viii) (16,393) - (15,155) - Adjusted EBITDA ($4,053) $1,650 ($8,722) $2,627 Pro forma impact on EBITDA (ix) - 429 - 1,527 Pro Forma Adjusted EBITDA ($4,053) $2,079 ($8,722) $4,154 Supplemental Non-GAAP Information Adjusted EBITDA and Pro Forma Adjusted EBITDA 13 i. Redwire incurred acquisition costs including due diligence and integration costs. ii. Redwire incurred acquisition costs related to the Roccor and MIS contingent earnout payments and purchase accounting fair value adjustments to unwind deferred revenue for MIS and DPSS. iii. Redwire incurred severance costs related to separation agreements entered into with former employees, including, but not limited to, the Company’s former CFO. iv. Redwire incurred capital market and advisory fees related to advisors assisting with preparation for the Merger and transitional costs associated with becoming a public company. v. Redwire incurred expenses related to the Audit Committee investigation and securities litigation. vi. Redwire incurred expenses related to equity-based compensation under Redwire’s equity-based compensation plan. vii. Redwire incurred expenses related to the committed equity facility with B. Riley, which includes consideration paid to enter into the Purchase Agreement as well as changes in the fair value of the committed equity facility derivative asset. viii. Redwire adjusted the fair value of the private warrant liability with changes in fair value recognized as a gain or loss during the respective periods. ix. Pro forma impact is computed in a manner consistent with the concepts of Article 8 of Regulation S-X and represents the incremental results of a full period of operations assuming the entities acquired during the periods presented were acquired from January 1 of the year in which they occurred. For the three months ended June 30, 2021, the pro forma impact included the results of Techshot, while the six months ended June 30, 2021, included the results of Oakman, DPSS and Techshot. Adjusted EBITDA and Pro Forma Adjusted EBITDA are non-GAAP measures that should not be considered in isolation or as a substitute for the relevant U.S. GAAP measures and should be read in conjunction with information presented on a U.S. GAAP basis and the following reconciliation to net income, the most directly comparable GAAP measure. Adjusted EBITDA is defined as net income (loss) adjusted for interest expense (income), income tax (benefit) expense, depreciation and amortization, impairment expense, acquisition deal costs, acquisition integration costs, acquisition earnout costs, purchase accounting fair value adjustment related to deferred revenue, severance costs, capital market and advisory fees, write-off of long-lived assets, equity-based compensation, committed equity facility transaction costs, and warrant liability fair value adjustments. Pro Forma Adjusted EBITDA is defined as Adjusted EBITDA further adjusted for the incremental Adjusted EBITDA that acquired businesses would have contributed for the periods presented if such acquisitions had occurred on January 1 of the year in which they occurred. Accordingly, historical financial information for the businesses acquired includes pro forma adjustments calculated in a manner consistent with the concepts of Article 8 of Regulation S-X, which are ultimately added back in the calculation of Adjusted EBITDA. As an emerging growth company that has completed a significant number of acquisitions in 2020 and 2021, we believe Pro Forma Adjusted EBITDA provides meaningful insights into the impact of strategic acquisitions as well as an indicative run rate of the Company’s future operating performance. ($ in thousands)
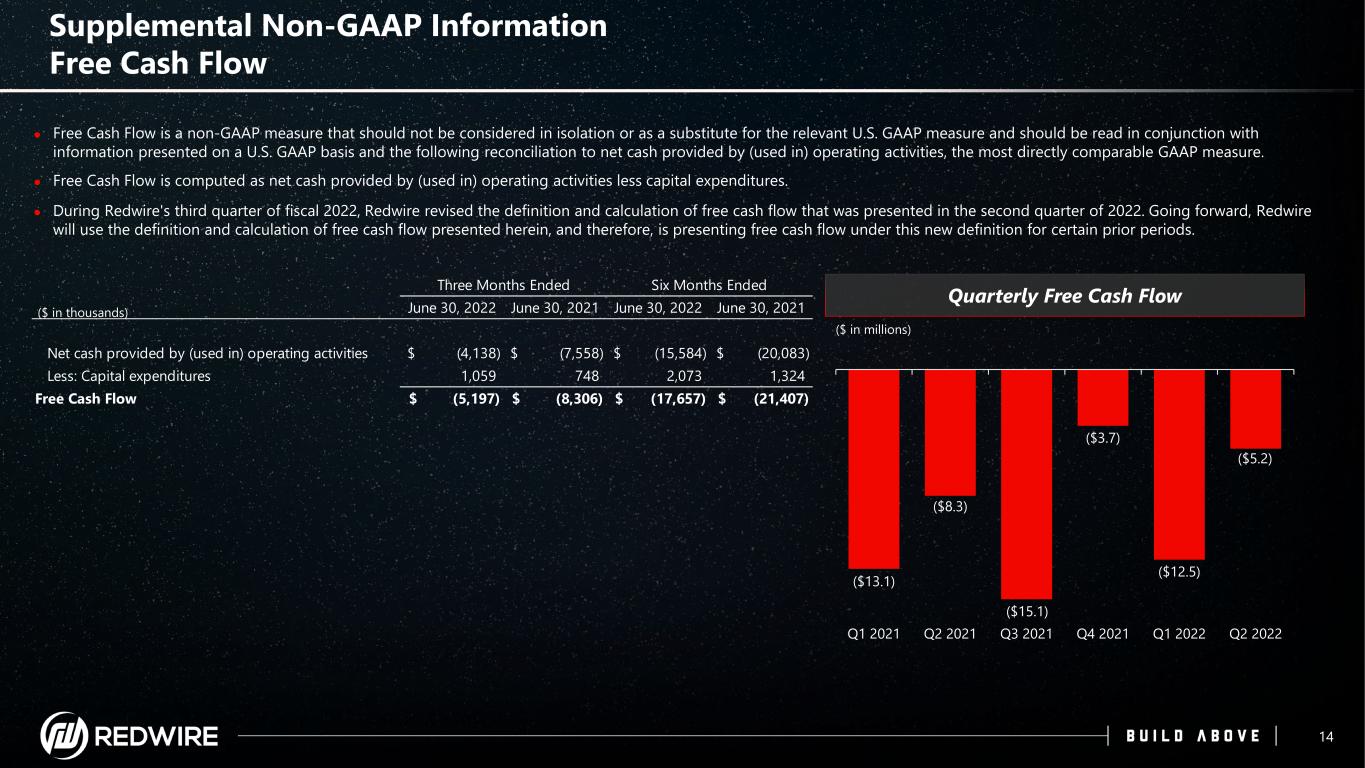
1. Insert Footnote Three Months Ended Six Months Ended June 30, 2022 June 30, 2021 June 30, 2022 June 30, 2021 Net cash provided by (used in) operating activities (4,138)$ (7,558)$ (15,584)$ (20,083)$ Less: Capital expenditures 1,059 748 2,073 1,324 Free Cash Flow (5,197)$ (8,306)$ (17,657)$ (21,407)$ ($13.1) ($8.3) ($15.1) ($3.7) ($12.5) ($5.2) Q1 2021 Q2 2021 Q3 2021 Q4 2021 Q1 2022 Q2 2022 Quarterly Free Cash Flow Supplemental Non-GAAP Information Free Cash Flow 14 ($ in millions) Free Cash Flow is a non-GAAP measure that should not be considered in isolation or as a substitute for the relevant U.S. GAAP measure and should be read in conjunction with information presented on a U.S. GAAP basis and the following reconciliation to net cash provided by (used in) operating activities, the most directly comparable GAAP measure. Free Cash Flow is computed as net cash provided by (used in) operating activities less capital expenditures. During Redwire's third quarter of fiscal 2022, Redwire revised the definition and calculation of free cash flow that was presented in the second quarter of 2022. Going forward, Redwire will use the definition and calculation of free cash flow presented herein, and therefore, is presenting free cash flow under this new definition for certain prior periods. ($ in thousands)