
Exhibit 99.1
1. Insert Footnote Canaccord Genuity 42 nd Annual Growth Conference August 1, 2022 Jonathan E. Baliff, Chief Financial Officer
Disclaimers Industry and market data used in this Presentation have been obtained from third - party industry publications and sources as well as from research reports prepared for other purposes . Redwire has not independently verified the data obtained from these sources and cannot assure you of the data’s accuracy or completeness . This data is subject to change . Recipients of this Presentation are not to construe its contents, or any prior or subsequent communications from or with Redwire or its representatives as investment, legal or tax advice . In addition, this Presentation does not purport to be all - inclusive or to contain all of the information that may be required to make a full analysis of Redwire . Recipients of this Presentation should each make their own evaluation of Redwire and of the relevance and adequacy of the information and should make such other investigations as they deem necessary . Statements other than historical facts, including but not limited to those concerning market conditions or trends, consumer or customer preferences or other similar concepts with respect to Redwire, are based on current expectations, estimates, projections, targets, opinions and/or beliefs of Redwire or, when applicable, of one or more third - party sources . Such statements involve known and unknown risks, uncertainties and other factors, and undue reliance should not be placed thereon . In addition, no representation or warranty is made with respect to the reasonableness of any estimates, forecasts, illustrations, prospects or returns, which should be regarded as illustrative only, or that any profits will be realized . The metrics regarding select aspects of Redwire's operations were selected by Redwire or its subsidiaries on a subjective basis . Such metrics are provided solely for illustrative purposes to demonstrate elements of Redwire's businesses, are incomplete, and are not necessarily indicative of Redwire’s or its subsidiaries’ performance or overall operations . There can be no assurance that historical trends will continue . The 2022 financial outlook, non - GAAP financial information and backlog information included in this presentation is unaudited, and in the case of future periods, is preliminary and subject to completion . Additionally, such information reflects management’s current views, and may change as a result of management’s review of results and other information, which may not be currently available . The financial outlook, including the related non - GAAP information, is subject to the finalization of year - end financial and accounting procedures (which have yet to be performed) and should not be viewed as a substitute for audited results prepared in accordance with U . S . generally accepted accounting principles . The actual results may be materially different from the preliminary results . See the factors discussed under the caption “Risk Factors” in the Company’s December 31 , 2021 , Form 10 - K filed with the Securities and Exchange Commission ("SEC") on April 11 , 2022 . Forward - Looking Statements Readers are cautioned that the statements contained in this Presentation regarding expectations of our performance or other matters that may affect our business, results of operations, or financial condition are “forward looking statements” as defined by the “safe harbor” provisions in the Private Securities Litigation Reform Act of 1995 . Such statements are made in reliance on the safe harbor provisions of Section 27 A of the Securities Act of 1933 and Section 21 E of the Securities Exchange Act of 1934 . All statements, other than statements of historical fact, included or incorporated in this press release, including statements regarding our strategy, financial position, guidance, funding for continued operations, cash reserves, liquidity, projected costs, plans, projects, awards and contracts, and objectives of management, are forward looking statements . Words such as “expect,” “anticipate,” “should,” “believe,” “hope,” “target,” “continued,” “project,” “plan,” “goals,” “opportunity,” “appeal,” “estimate,” “potential,” “predict,” “may,” “will,” “might,” “could,” “intend,” “shall,” “possible,” “would,” “approximately,” “likely,” “schedule,” and variations of these terms or the negative of these terms and similar expressions are intended to identify these forward - looking statements, but the absence of these words does not mean that a statement is not forward looking . These forward - looking statements are not guarantees of future performance, conditions or results . Forward looking statements are subject to a number of risks and uncertainties, many of which involve factors or circumstances that are beyond our control . These factors and circumstances include, but are not limited to : ( 1 ) the company’s limited operating history ; ( 2 ) the development and continued refinement of many of the company’s proprietary technologies, produces and service offerings ; ( 3 ) the possibility that the company’s assumptions relating to future results may prove incorrect ; ( 4 ) the inability to successfully integrate recently completed and future acquisitions ; ( 5 ) the possibility that the company may be adversely affected by other macroeconomic, business, and/or competitive factors ; ( 6 ) the impacts of COVID - 19 on the company’s business ; ( 7 ) unsatisfactory performance of our products ; ( 8 ) the emerging nature of the market for in - space infrastructure services ; ( 9 ) inability to realize benefits from new offerings or the application of our technologies ; ( 10 ) the inability to convert orders in backlog into revenue ; ( 11 ) data breaches or incidents involving the company’s technology ; ( 12 ) the company’s dependence on senior management and other highly skilled personnel ; ( 13 ) incurrence of significant expenses and capital expenditures to execute our business plan ; ( 14 ) the ability to recognize the anticipated benefits of the business combination Genesis Park Acquisition Corp . , which may be affected by, among other things, competition, the ability of the combined company to grow and manage growth profitably, maintain relationships with customers and suppliers and retain its management and key employees ; ( 15 ) costs related to the business combination with Genesis Park Acquisition Corp .; ( 16 ) early termination, audits, investigations, sanctions and penalties with respect to government contracts ; ( 17 ) inability to report our financial condition or results of operations accurately or timely as a result of identified material weaknesses ; ( 18 ) inability to meet or maintain stock exchange listing standards ; ( 19 ) the need for substantial additional funding to finance our operations, which may not be available when we need it, on acceptable terms or at all ; ( 20 ) significant fluctuation of our operating results ; ( 21 ) adverse publicity stemming from any incident involving the Company or its competitors ; ( 22 ) changes in applicable laws or regulations ; ; and ( 23 ) other risks and uncertainties described in our most recent Annual Report on Form 10 - K and Quarterly Reports on Form 10 - Q and those indicated from time to time in other documents filed or to be filed with the SEC by the Company . The forward - looking statements contained in this presentation are based on our current expectations and beliefs concerning future developments and their potential effects on us . If underlying assumptions to forward looking statements prove inaccurate, or if known or unknown risks or uncertainties materialize, actual results could vary materially from those anticipated, estimated, or projected . The forward - looking statements contained in this press release are made as of the date of this press release, and the Company disclaims any intention or obligation, other than imposed by law, to update or revise any forward - looking statements, whether as a result of new information, future events, or otherwise . Persons reading this press release are cautioned not to place undue reliance on forward looking statements . 2
Non - GAAP Financial Information This Presentation contains financial measures that have not been prepared in accordance with United States Generally Accepted Accounting Principles (“U . S . GAAP”) . These financial measures include Total backlog, book - to - bill, Adjusted EBITDA, Pro Forma Adjusted EBITDA and Free Cash Flow . We use certain financial measures to evaluate our operating performance, generate future operating plans, and make strategic decisions, including those relating to operating expenses and the allocation of internal resources which are not calculated in accordance with U . S . GAAP and are considered to be Non - GAAP financial performance measures . These Non - GAAP financial performance measures are used to supplement the financial information presented on a U . S . GAAP basis and should not be considered in isolation or as a substitute for the relevant U . S . GAAP measures and should be read in conjunction with information presented on a U . S . GAAP basis . Because not all companies use identical calculations, our presentation of Non - GAAP measures may not be comparable to other similarly titled measures of other companies . Adjusted EBITDA and Pro Forma Adjusted EBITDA are two such Non - GAAP financial measures that we use . Adjusted EBITDA is defined as net income (loss) adjusted for interest expense (income), net, income tax (benefit) expense, depreciation and amortization, impairment expense, acquisition deal costs, acquisition integration costs, acquisition earnout costs, purchase accounting fair value adjustment related to deferred revenue, severance costs, capital market and advisory fees, write - off of long - lived assets, equity - based compensation, committed equity facility transaction costs, and warrant liability fair value adjustments . Pro Forma Adjusted EBITDA is computed in accordance with Article 8 of Regulation S - X and is computed to give effect to the business combinations as if they occurred on January 1 of the year in which they occurred . Free Cash Flow is computed as Adjusted EBITDA less capital expenditures and changes in net working capital . Trademarks This Presentation contains trademarks, service marks, tradenames and copyrights of Redwire and other companies, which are the property of their respective owners . The use herein does not imply an affiliation with, or endorsement by, the owners of these service marks, trademarks and tradenames . Third - party logos herein may represent past customers, present customers or may be provided simply for illustrative purposes only . Inclusion of such logos does not necessarily imply affiliation with or endorsement by such firms or businesses . There is no guarantee that Redwire will work, or continue to work, with any of the firms or businesses whose logos are included herein in the future . 3
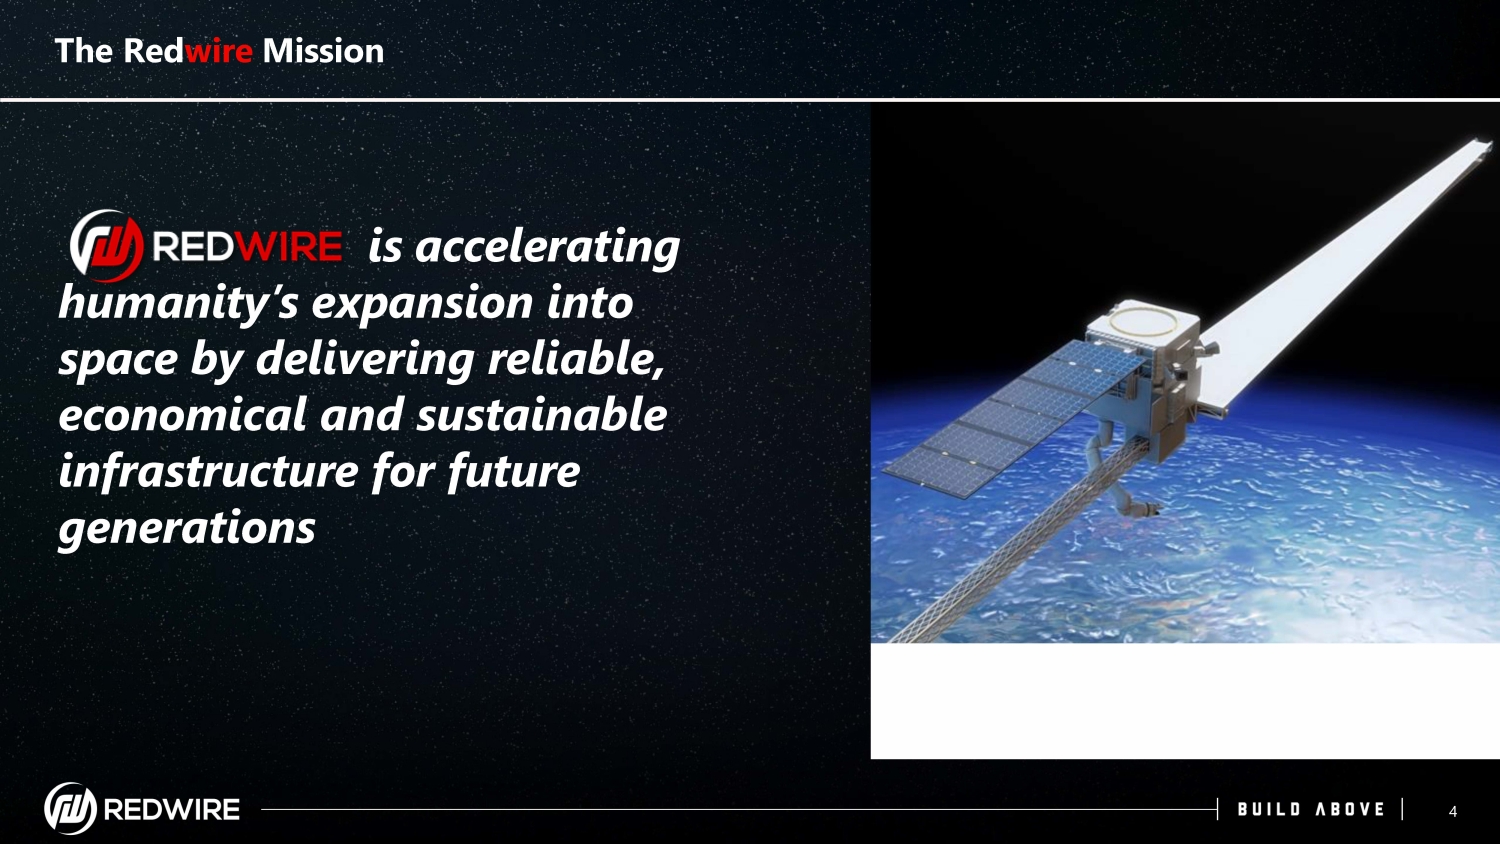
The Red wire Mission is accelerating humanity’s expansion into space by delivering reliable, economical and sustainable infrastructure for future generations 4
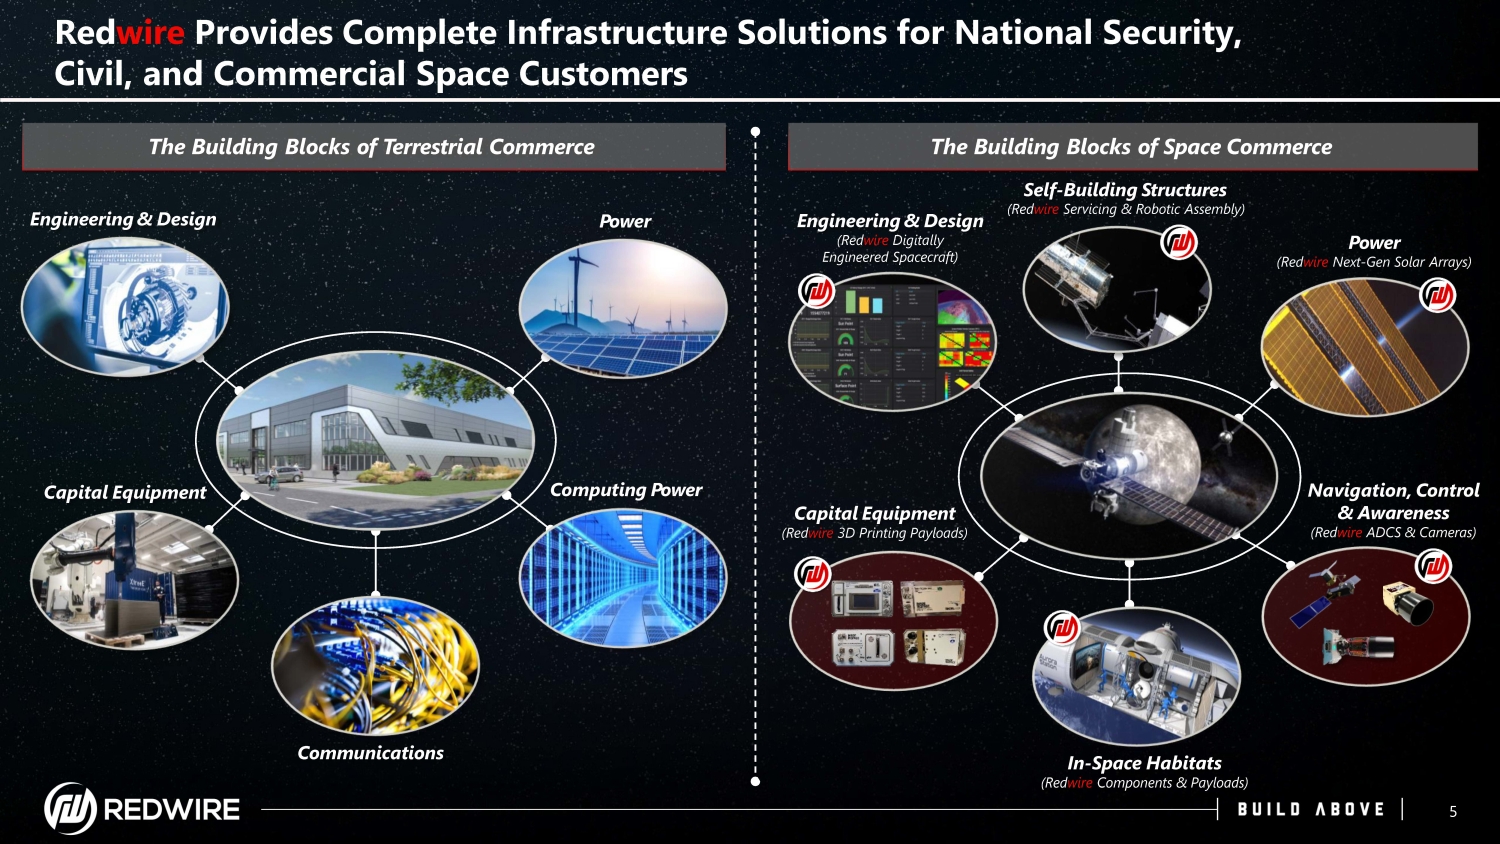
Red wire Provides Complete Infrastructure Solutions for National Security, Civil, and Commercial Space Customers The Building Blocks of Terrestrial Commerce Engineering & Design C ap i ta l E q ui pm ent P o w e r C o m p u t in g P o w e r Power (Red wire Next - Gen Solar Arrays) Capital Equipment (Red wire 3D Printing Payloads) Engineering & Design (Red wire Digitally Engineered Spacecraft) N a vi gat i o n , C o n t r o l & Awareness (Red wire ADCS & Cameras) Communications In - Space Habitats (Red wire Components & Payloads) The Building Blocks of Space Commerce Self - Building Structures (Red wire Servicing & Robotic Assembly) 5
Heritage + Disruptive Innovation Drives Customer Retention & Robust Backlog Red wire Investment Highlights: Pure - Play Space Investment With Scale Potential to Transform Space Economics and Create Markets for Commercialization Mission - Critical, Next Generation Infrastructure Provider Revenue Positive with High Visibility Into Near - Term Revenue Growth Proven Leadership; Valuable IP, Including for In - Space 3D Printing 6
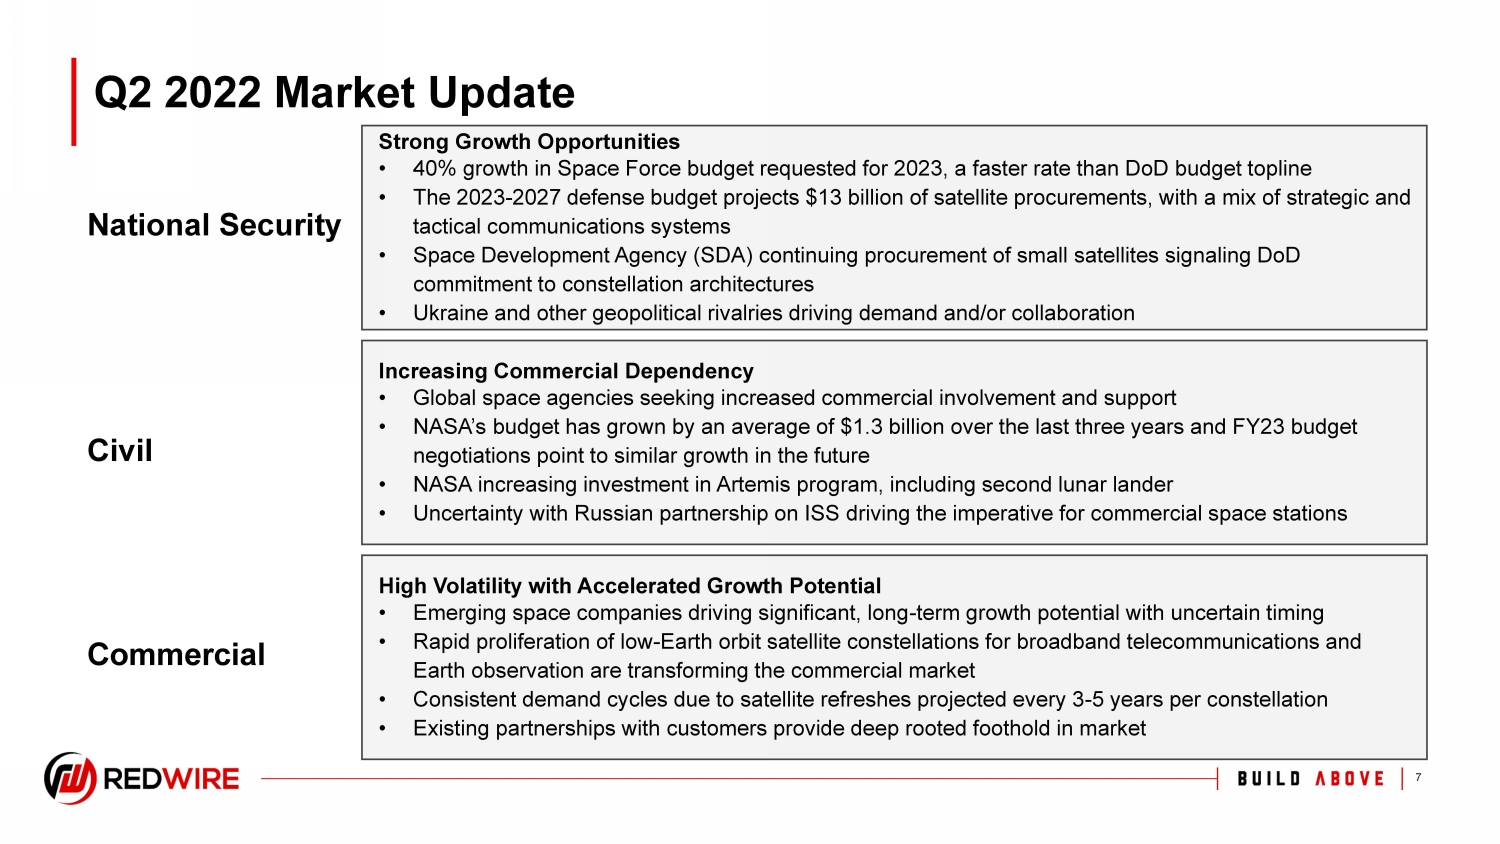
1. Insert Footnote Q2 2022 Market Update Civil Commercial Strong Growth Opportunities • 40% growth in Space Force budget requested for 2023, a faster rate than DoD budget topline • The 2023 - 2027 defense budget projects $13 billion of satellite procurements, with a mix of strategic and tactical communications systems • Space Development Agency (SDA) continuing procurement of small satellites signaling DoD commitment to constellation architectures • Ukraine and other geopolitical rivalries driving demand and/or collaboration Increasing Commercial Dependency • Global space agencies seeking increased commercial involvement and support • NASA’s budget has grown by an average of $1.3 billion over the last three years and FY23 budget negotiations point to similar growth in the future • NASA increasing investment in Artemis program, including second lunar lander • Uncertainty with Russian partnership on ISS driving the imperative for commercial space stations High Volatility with Accelerated Growth Potential • Emerging space companies driving significant, long - term growth potential with uncertain timing • Rapid proliferation of low - Earth orbit satellite constellations for broadband telecommunications and Earth observation are transforming the commercial market • Consistent demand cycles due to satellite refreshes projected every 3 - 5 years per constellation • Existing partnerships with customers provide deep rooted foothold in market National Security 7
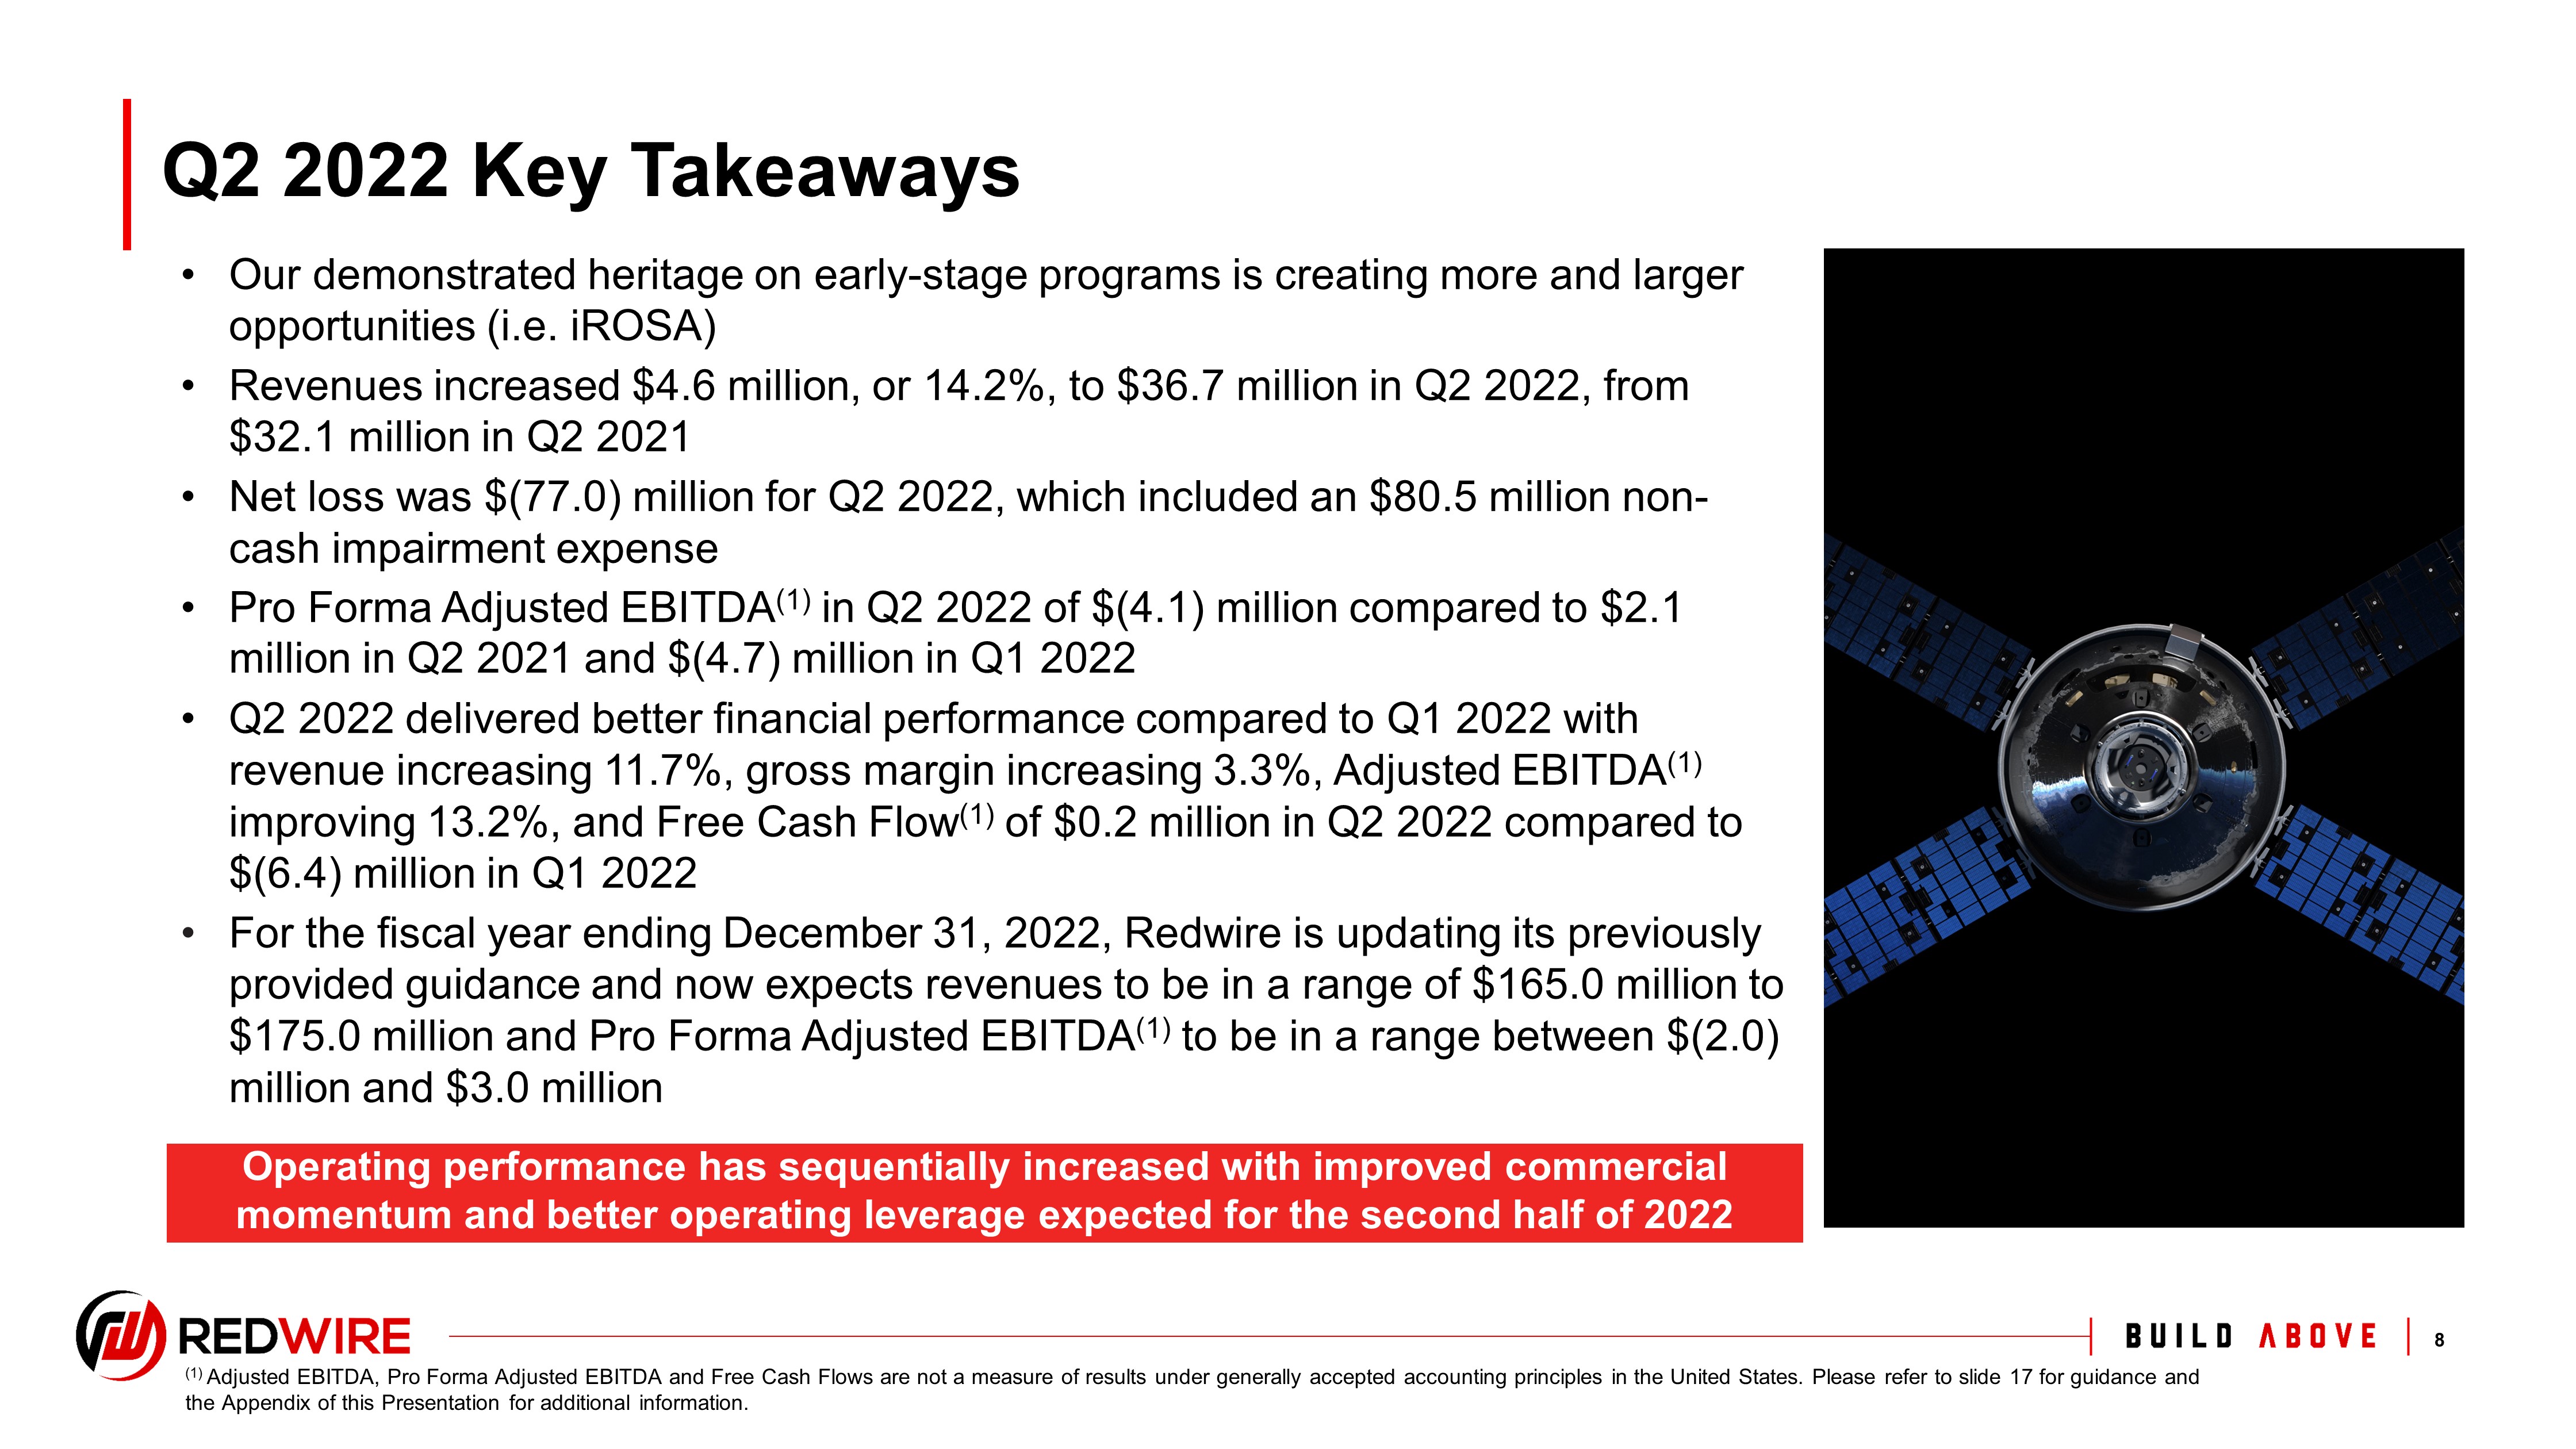
1. Insert Footnote Q2 2022 Key Takeaways • Our demonstrated heritage on early - stage programs is creating more and larger opportunities (i.e. iROSA) • Revenues increased $4.6 million, or 14.2%, to $36.7 million in Q2 2022, from $32.1 million in Q2 2021 • Net loss was $(77.0) million for Q2 2022, which included an $80.5 million non - cash impairment expense • Pro Forma Adjusted EBITDA (1) in Q2 2022 of $(4.1) million compared to $2.1 million in Q2 2021 and $(4.7) million in Q1 2022 • Q2 2022 delivered better financial performance compared to Q1 2022 with revenue increasing 11.7%, gross margin increasing 3.3%, Adjusted EBITDA (1) improving 13.2%, and Free Cash Flow (1) of $0.2 million in Q2 2022 compared to $(6.4) million in Q1 2022 • For the fiscal year ending December 31, 2022, Redwire is updating its previously provided guidance and now expects revenues to be in a range of $ 165.0 million to $ 175.0 million and Pro Forma Adjusted EBITDA (1) to be in a range between $(2.0) million and $3.0 million 8 Operating performance has sequentially increased with improved commercial momentum and better operating leverage expected for the second half of 2022 (1) Adjusted EBITDA, Pro Forma Adjusted EBITDA and Free Cash Flows are not a measure of results under generally accepted accounti ng principles in the United States. Please refer to slide 21 for guidance and the Appendix of this Presentation for additional information.
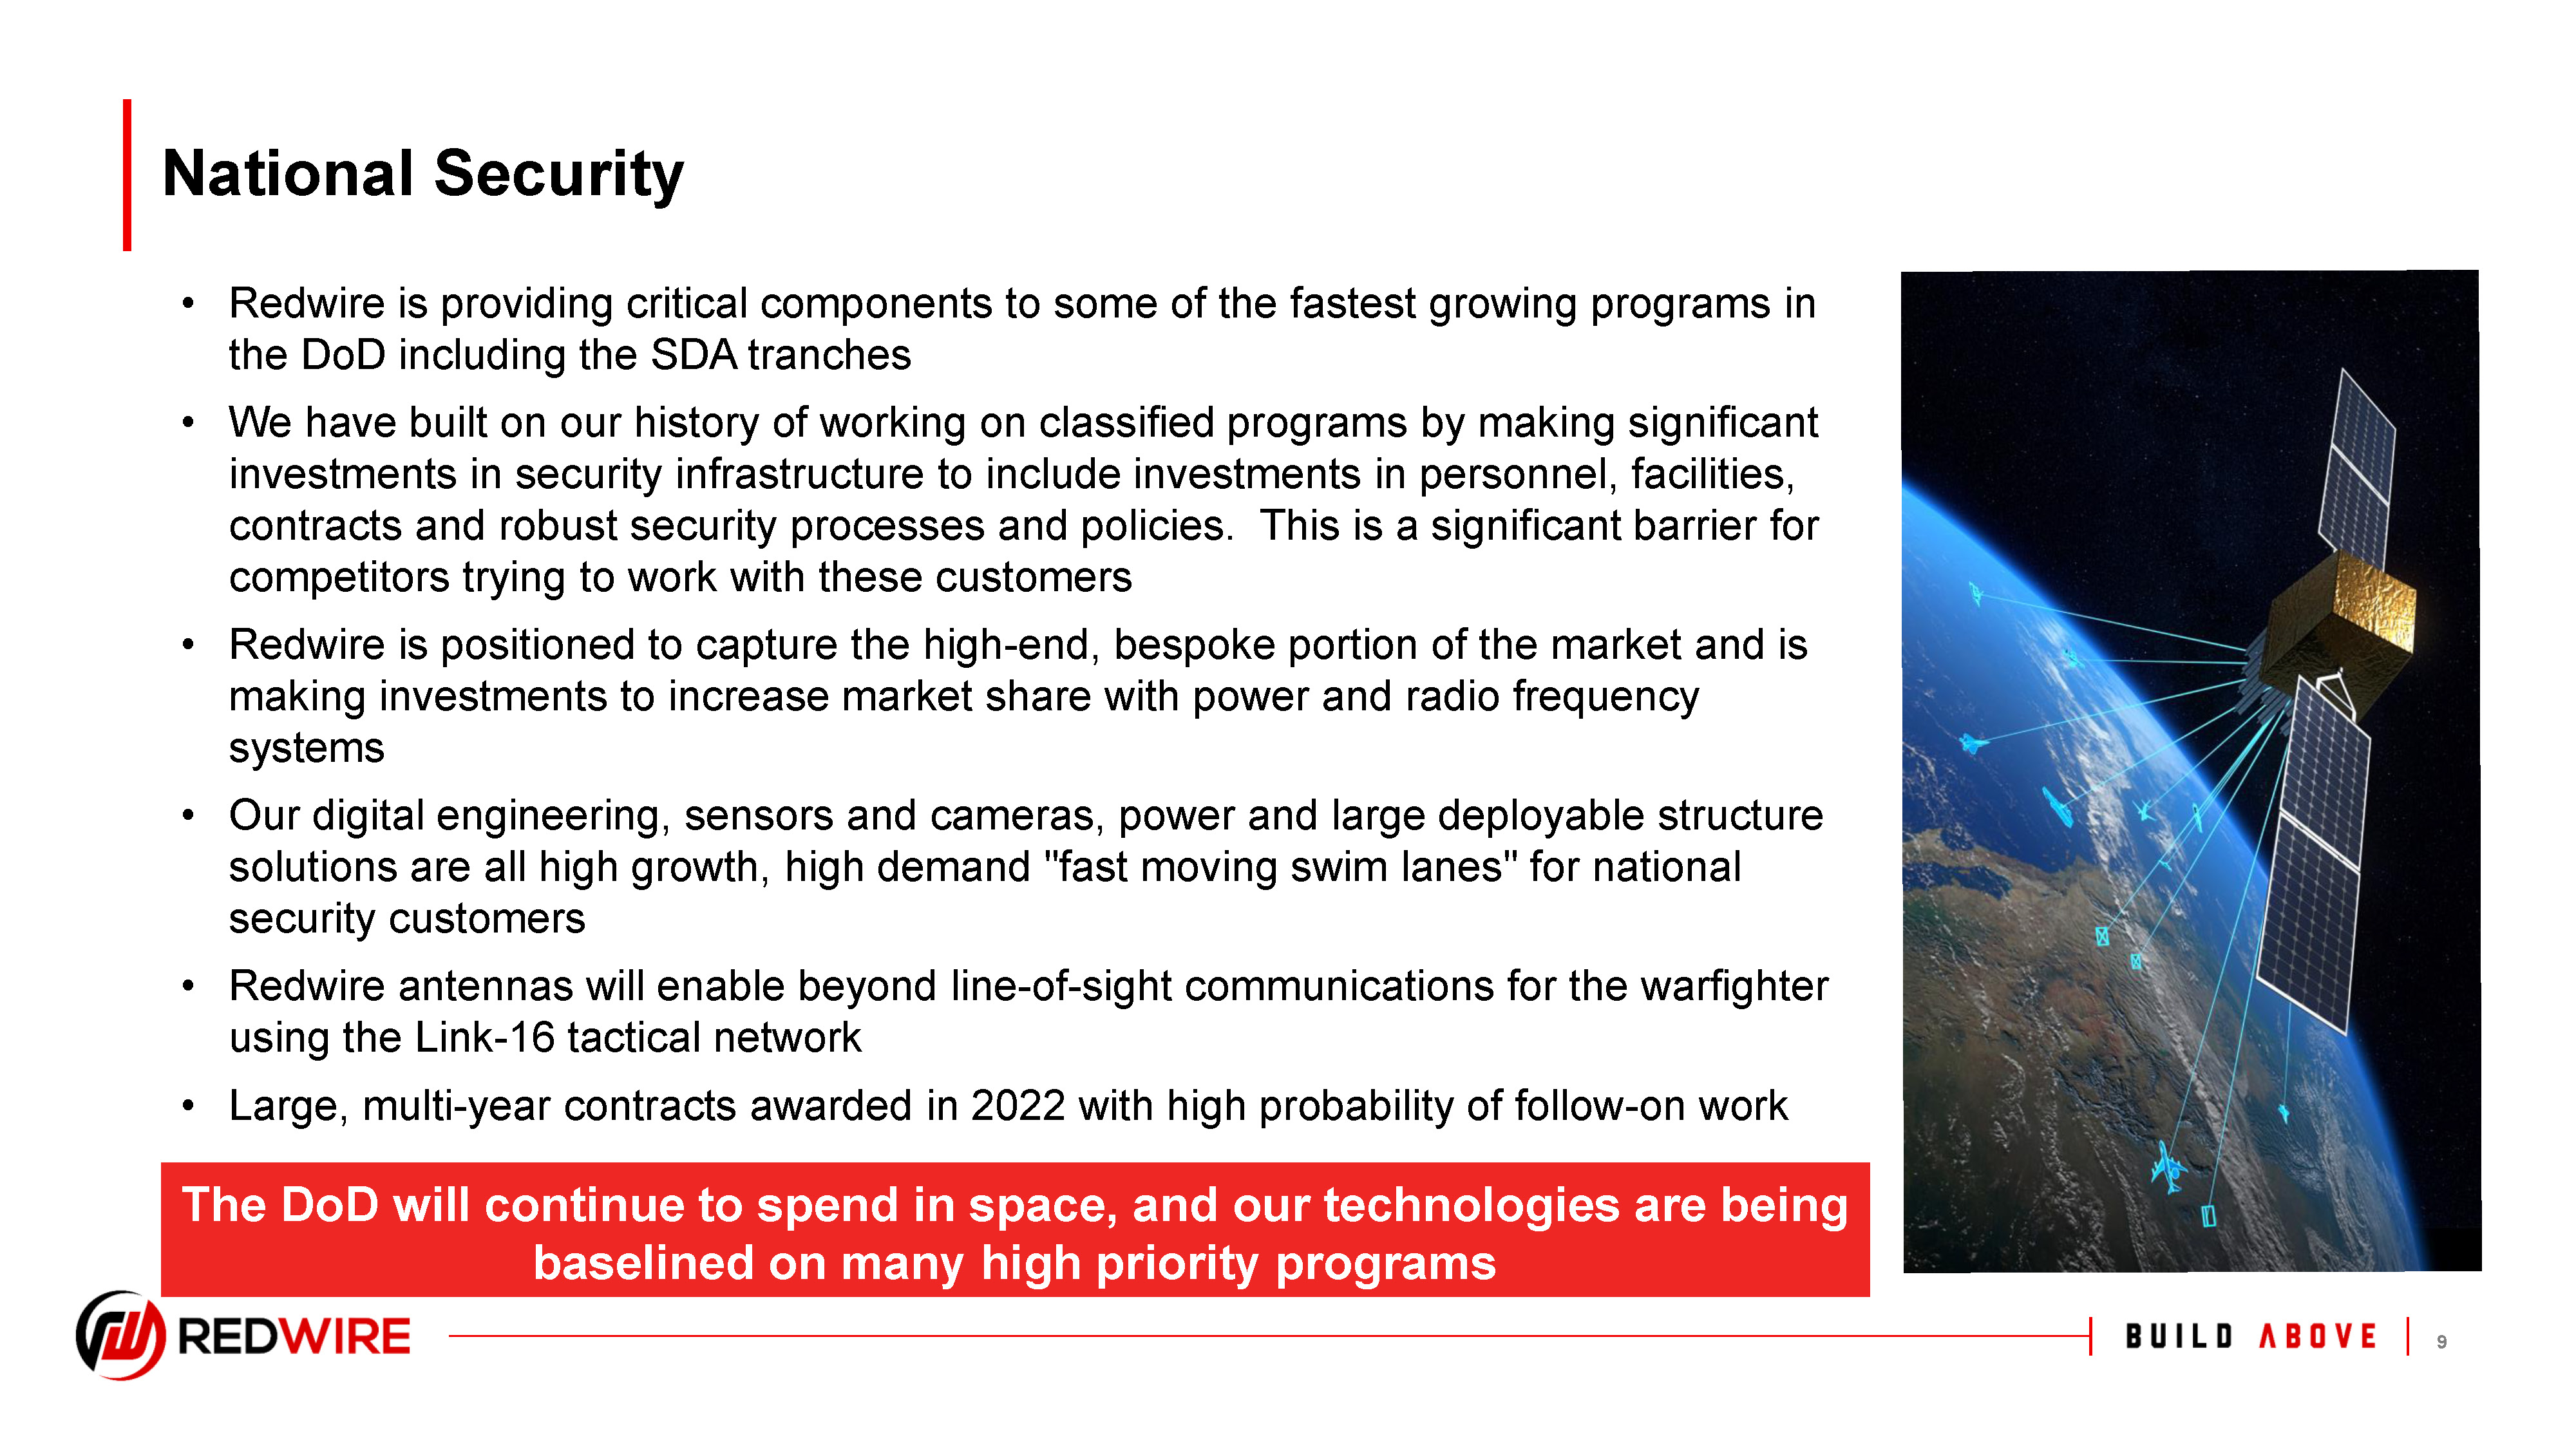
1. Insert Footnote 9 National Security • Redwire is providing critical components to some of the fastest growing programs in the DoD including the SDA tranches • We have built on our history of working on classified programs by making significant investments in security infrastructure to include investments in personnel, facilities, contracts and robust security processes and policies. This is a significant barrier for competitors trying to work with these customers • Redwire is positioned to capture the high-end, bespoke portion of the market and is making investments to increase market share with power and radio frequency systems • Our digital engineering, sensors and cameras, power and large deployable structure solutions are all high growth, high demand "fast moving swim lanes" for national security customers • Redwire antennas will enable beyond line-of-sight communications for the warfighter using the Link-16 tactical network • Large, multi-year contracts awarded in 2022 with high probability of follow-on work The DoD will continue to spend in space, and our technologies are being baselined on many high priority programs
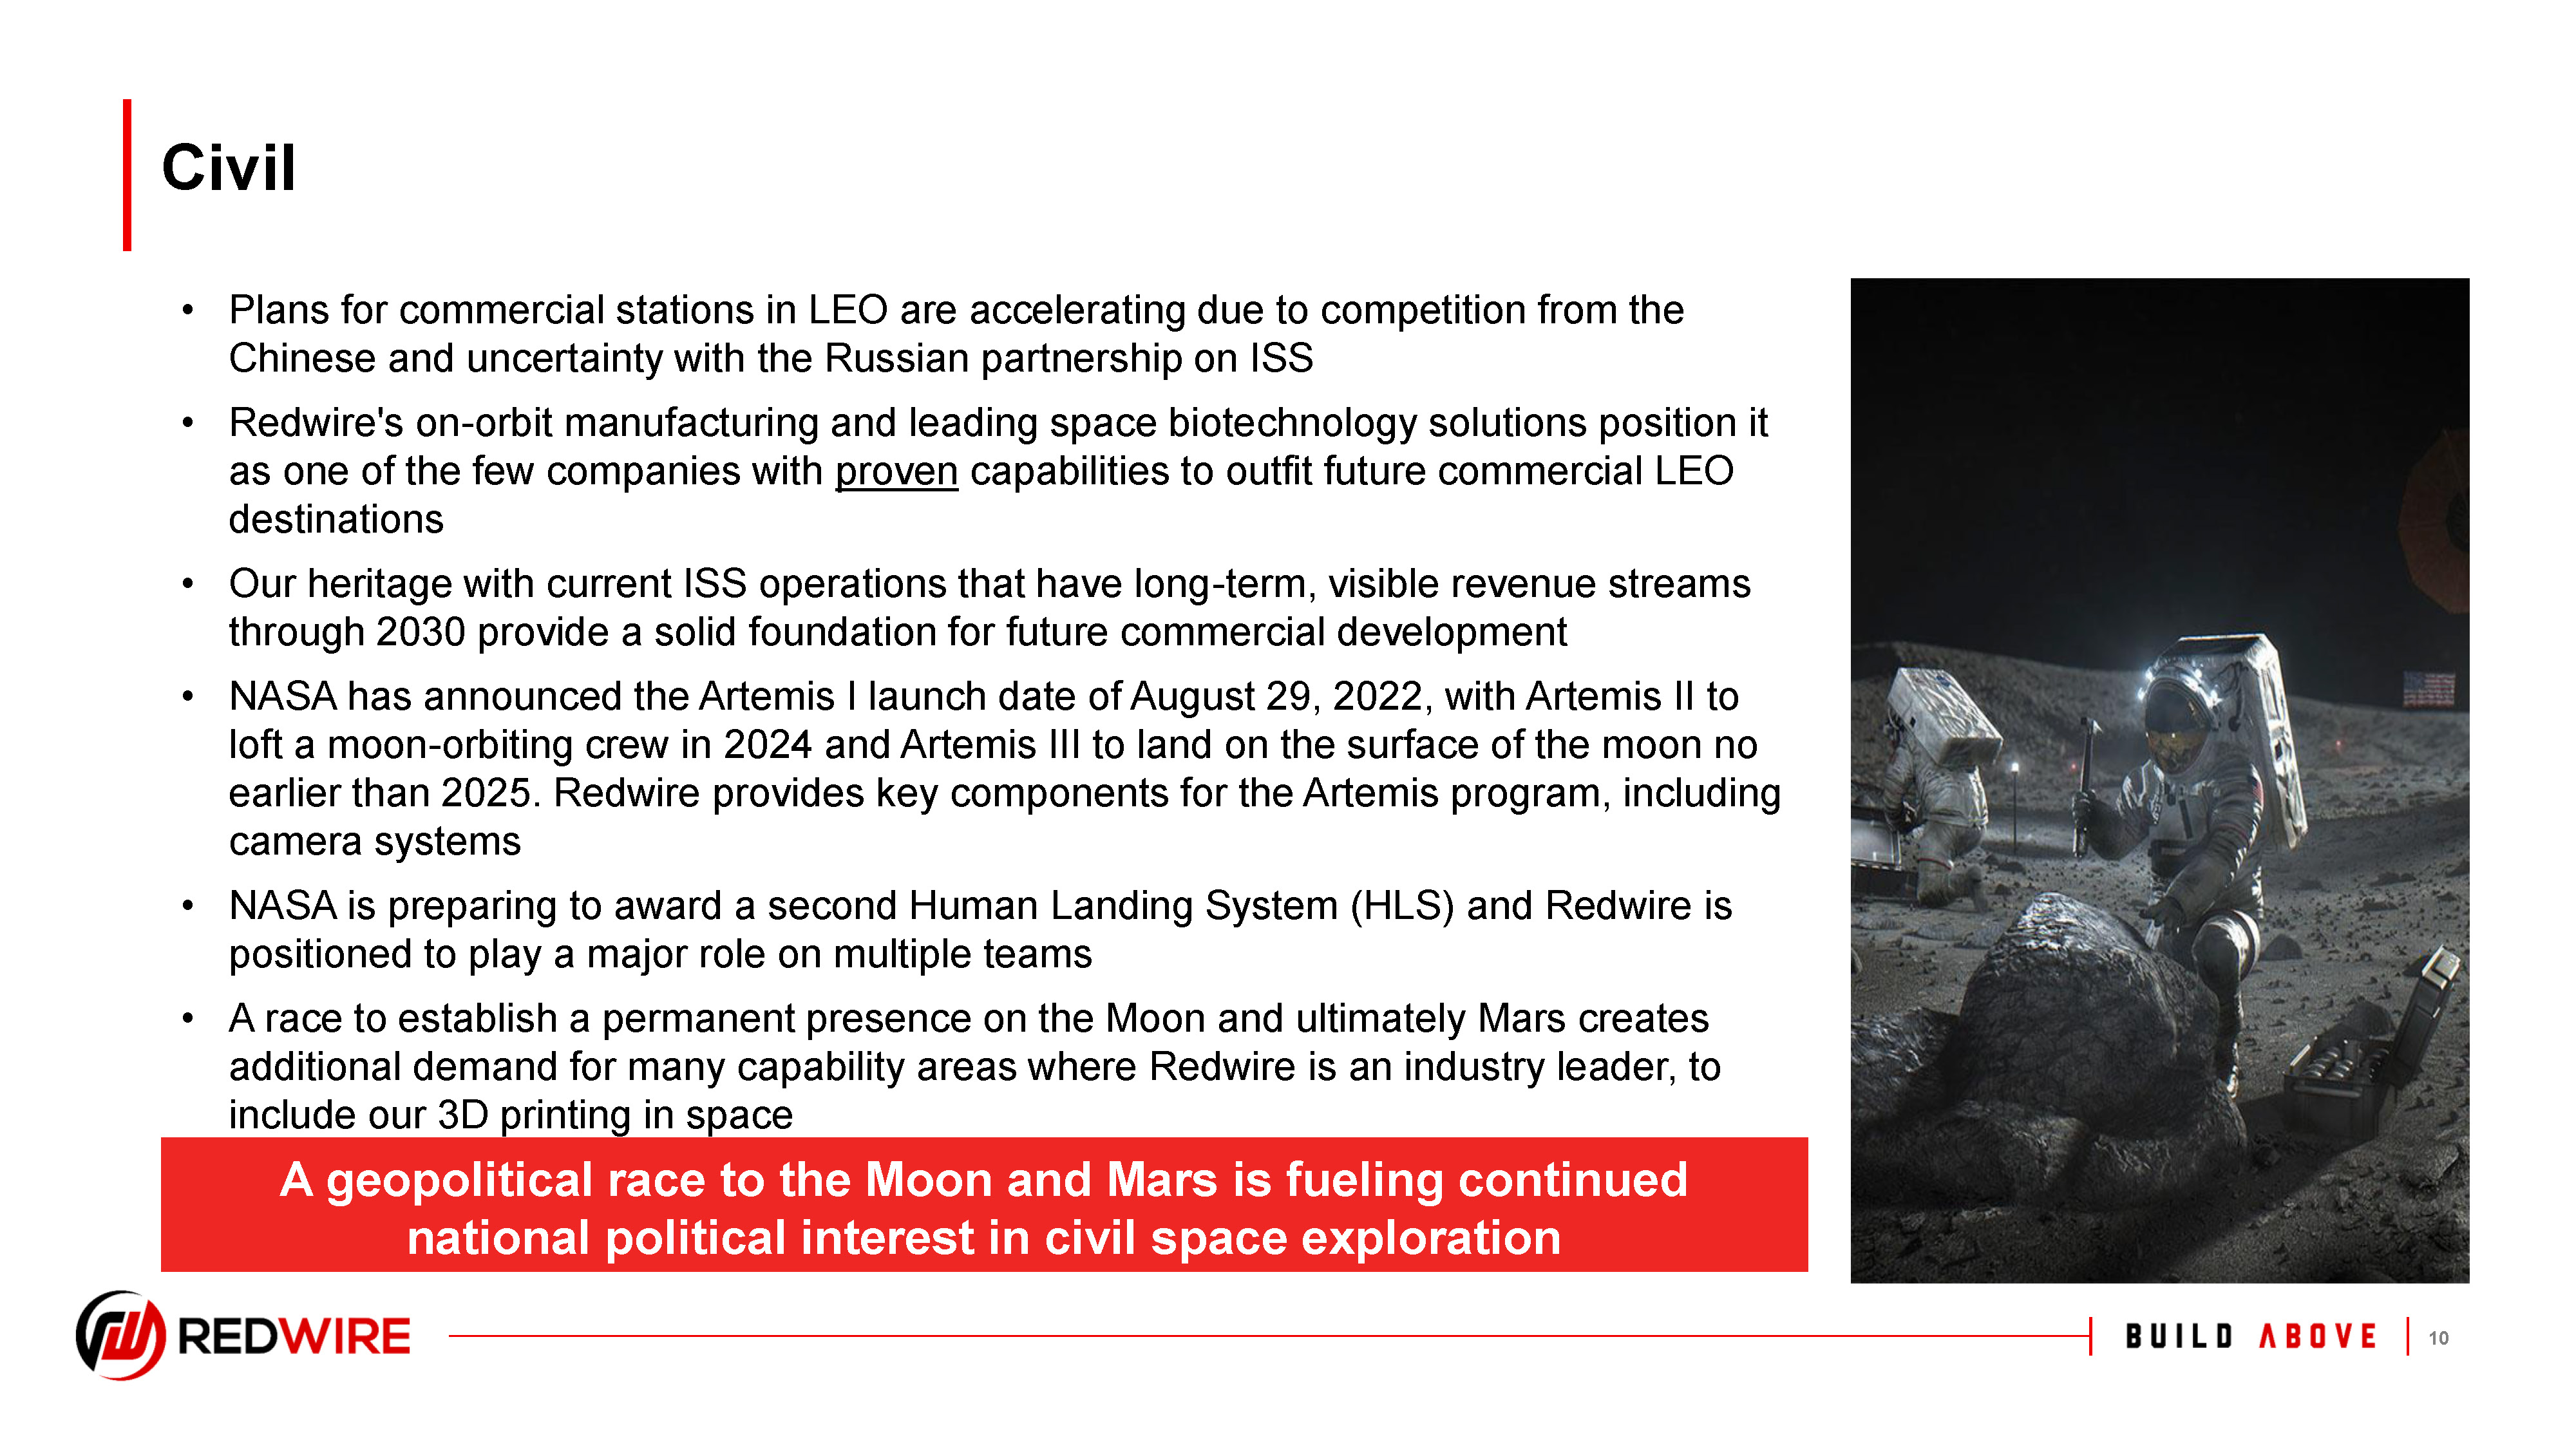
1. Insert Footnote 10 Civil • Plans for commercial stations in LEO are accelerating due to competition from the Chinese and uncertainty with the Russian partnership on ISS • Redwire's on-orbit manufacturing and leading space biotechnology solutions position it as one of the few companies with proven capabilities to outfit future commercial LEO destinations • Our heritage with current ISS operations that have long-term, visible revenue streams through 2030 provide a solid foundation for future commercial development • NASA has announced the Artemis I launch date of August 29, 2022, with Artemis II to loft a moon-orbiting crew in 2024 and Artemis III to land on the surface of the moon no earlier than 2025. Redwire provides key components for the Artemis program, including camera systems • NASA is preparing to award a second Human Landing System (HLS) and Redwire is positioned to play a major role on multiple teams • A race to establish a permanent presence on the Moon and ultimately Mars creates additional demand for many capability areas where Redwire is an industry leader, to include our 3D printing in space A geopolitical race to the Moon and Mars is fueling continued national political interest in civil space exploration
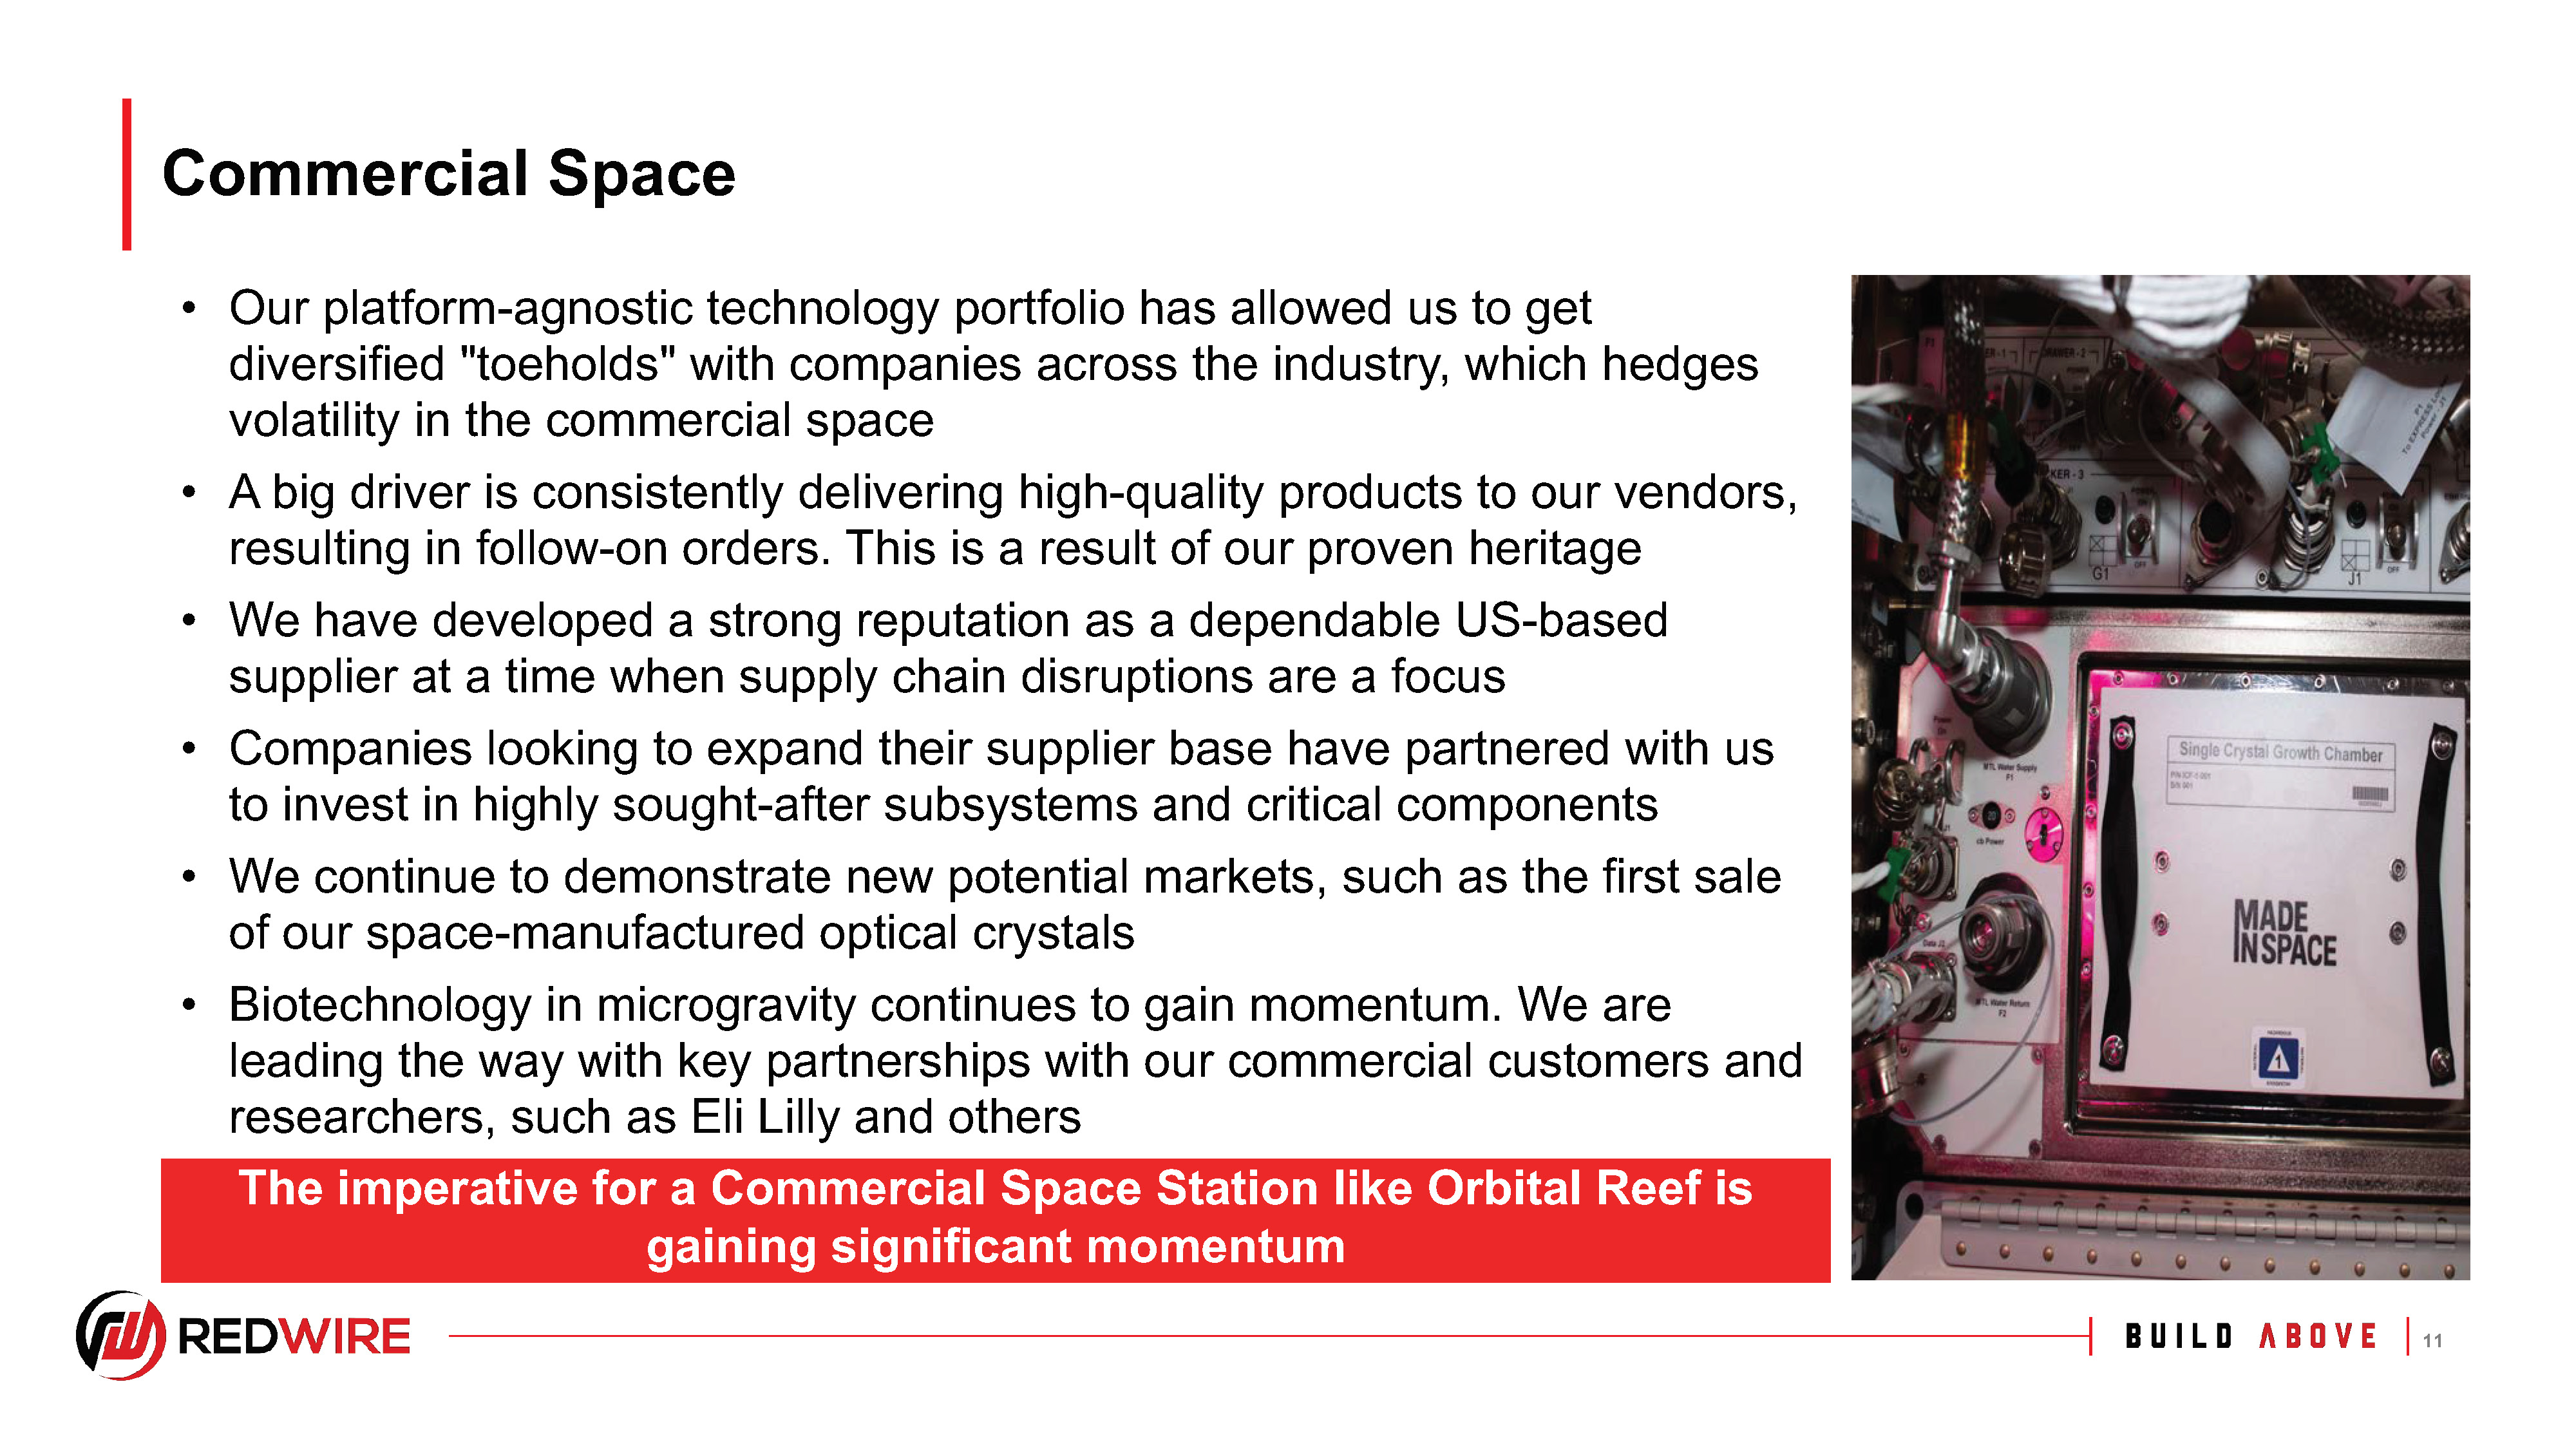
0 0 54 54 54 47 85 151 204 251 254 180 199 231 191 191 191 1. Insert Footnote 11 Commercial Space • Our platform-agnostic technology portfolio has allowed us to get diversified "toeholds" with companies across the industry, which hedges volatility in the commercial space • A big driver is consistently delivering high-quality products to our vendors, resulting in follow-on orders. This is a result of our proven heritage • We have developed a strong reputation as a dependable US-based supplier at a time when supply chain disruptions are a focus • Companies looking to expand their supplier base have partnered with us to invest in highly sought-after subsystems and critical components • We continue to demonstrate new potential markets, such as the first sale of our space-manufactured optical crystals • Biotechnology in microgravity continues to gain momentum. We are leading the way with key partnerships with our commercial customers and researchers, such as Eli Lilly and others The imperative for a Commercial Space Station like Orbital Reef is gaining significant momentum
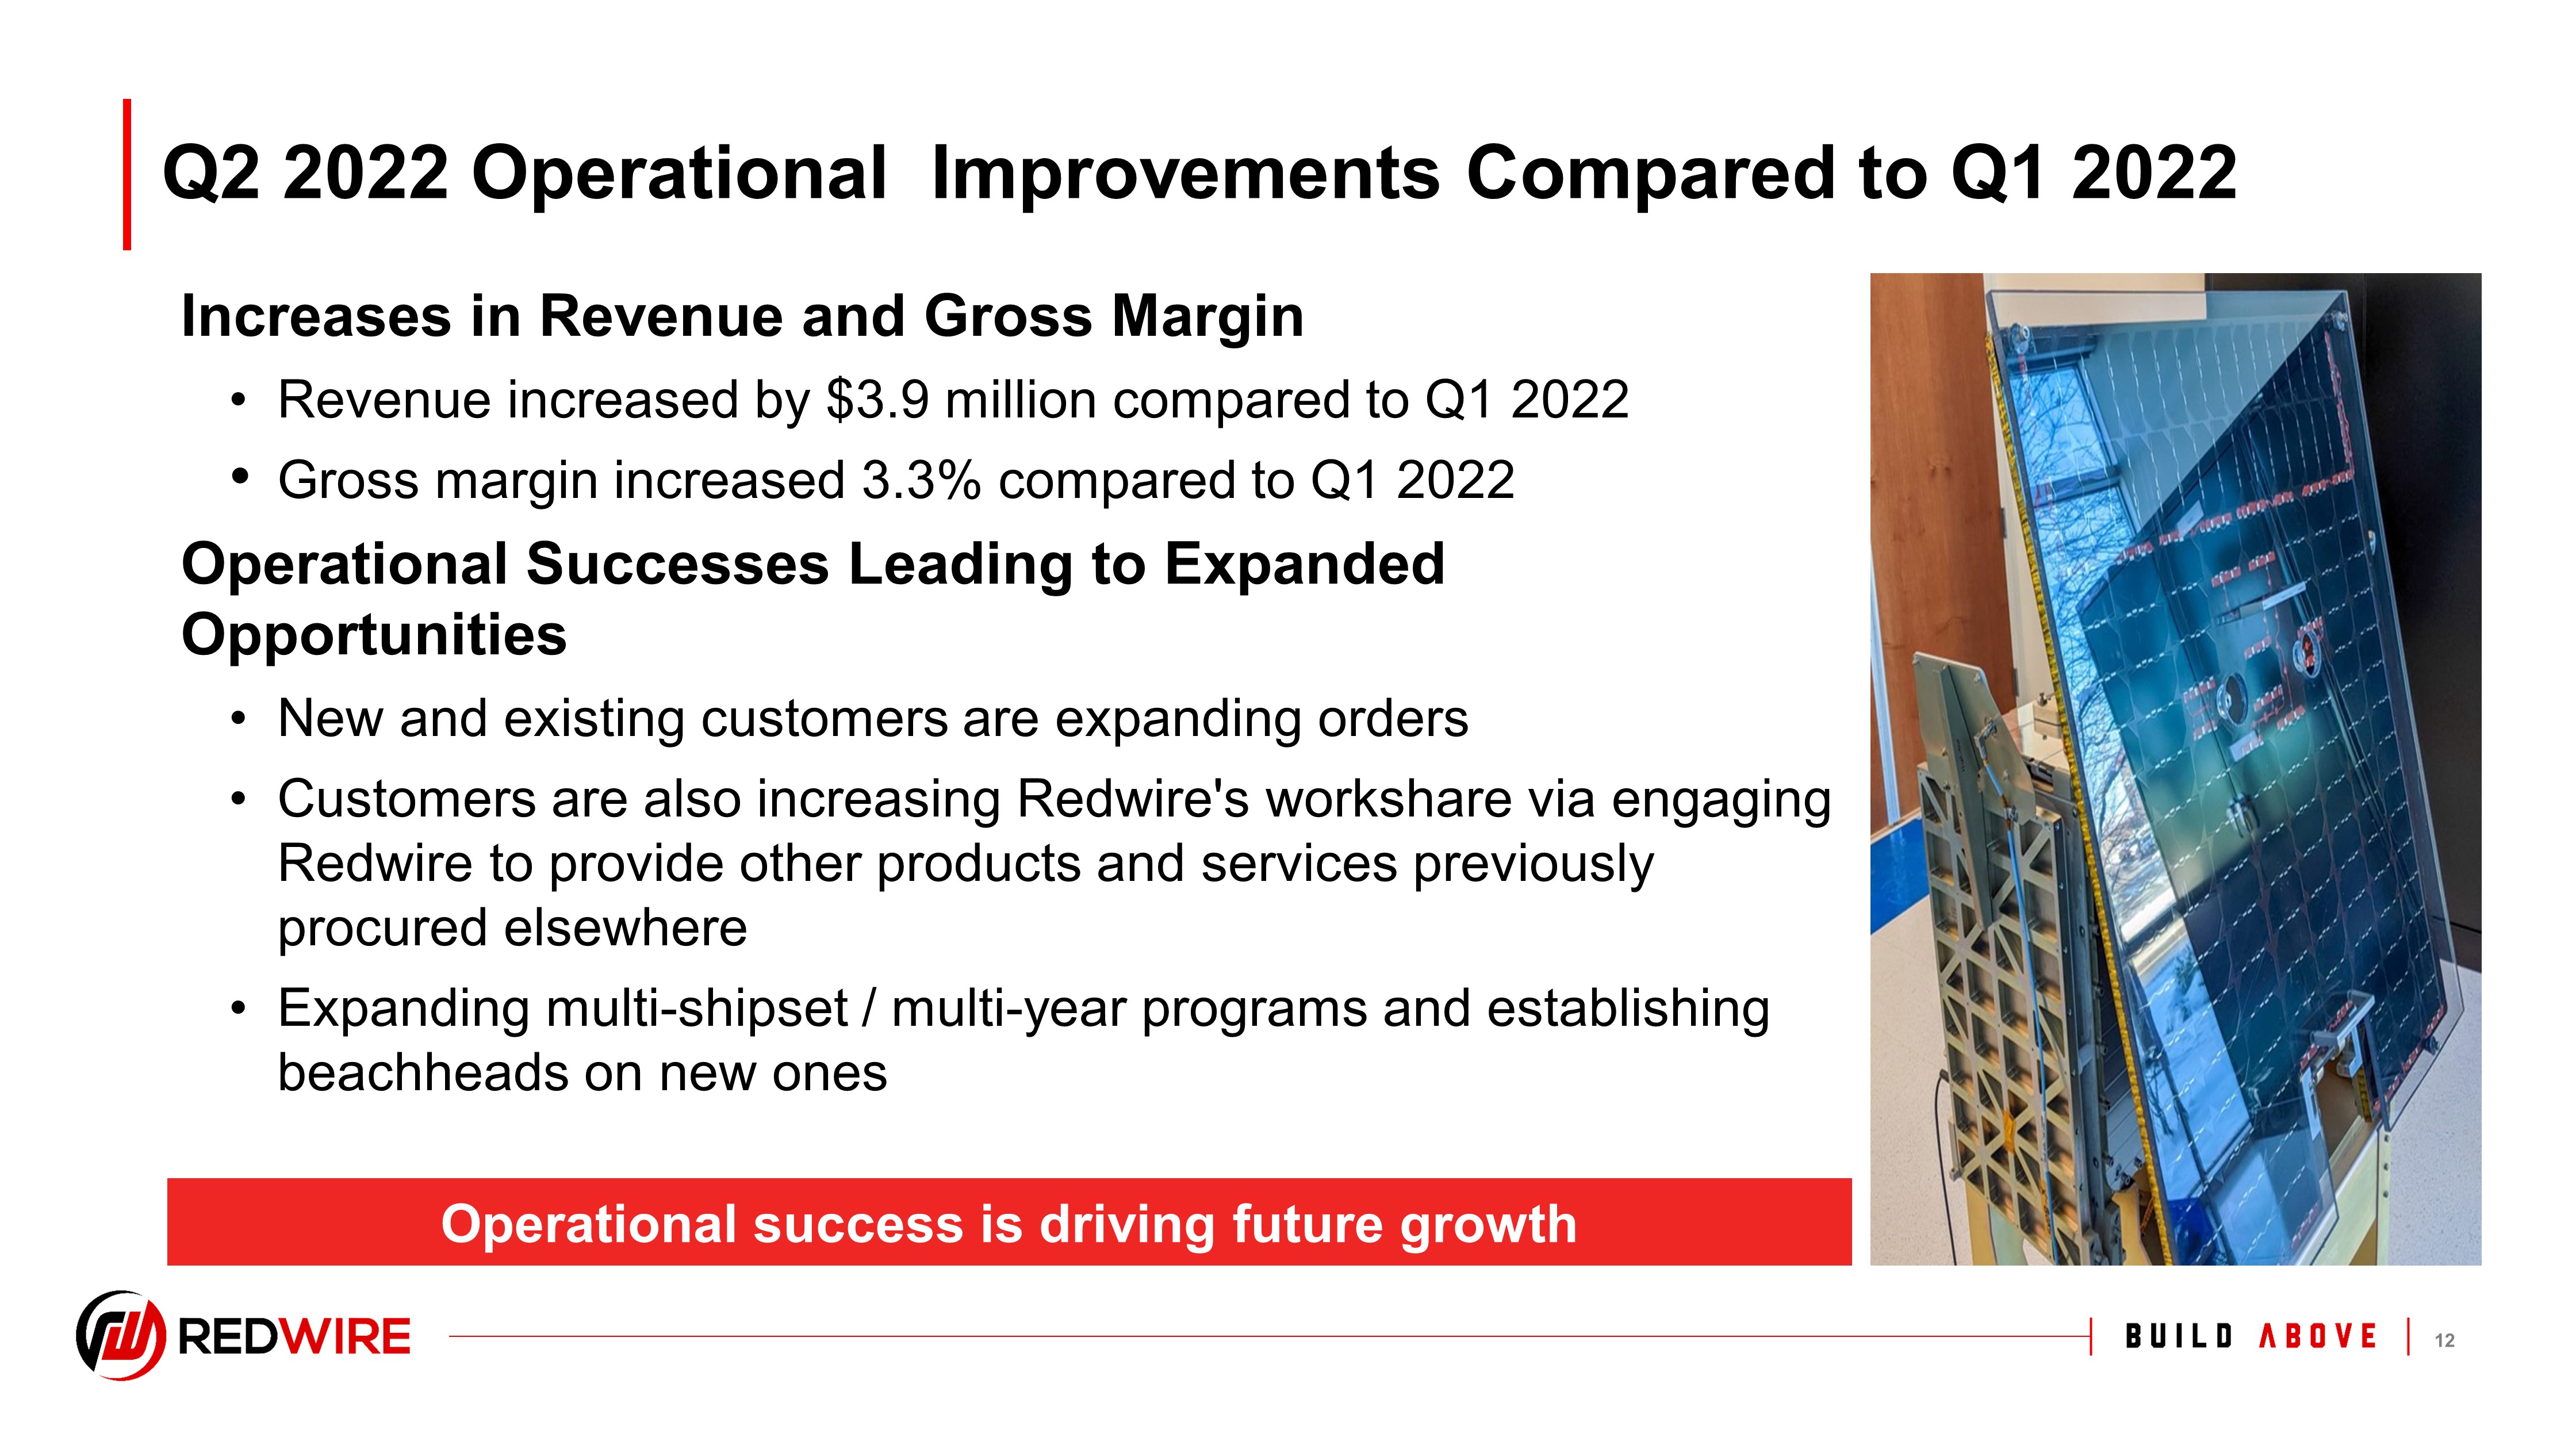
1. Insert Footnote 9 Q2 2022 Operational Improvements Compared to Q1 2022 Increases in Revenue and Gross Margin • Revenue increased by $3.9 million compared to Q1 2022 • Gross margin increased 3.3% compared to Q1 2022 Operational Successes Leading to Expanded Opportunities • New and existing customers are expanding orders • Customers are also increasing Redwire's workshare via engaging Redwire to provide other products and services previously procured elsewhere • Expanding multi - shipset / multi - year programs and establishing beachheads on new ones Operational success is driving future growth
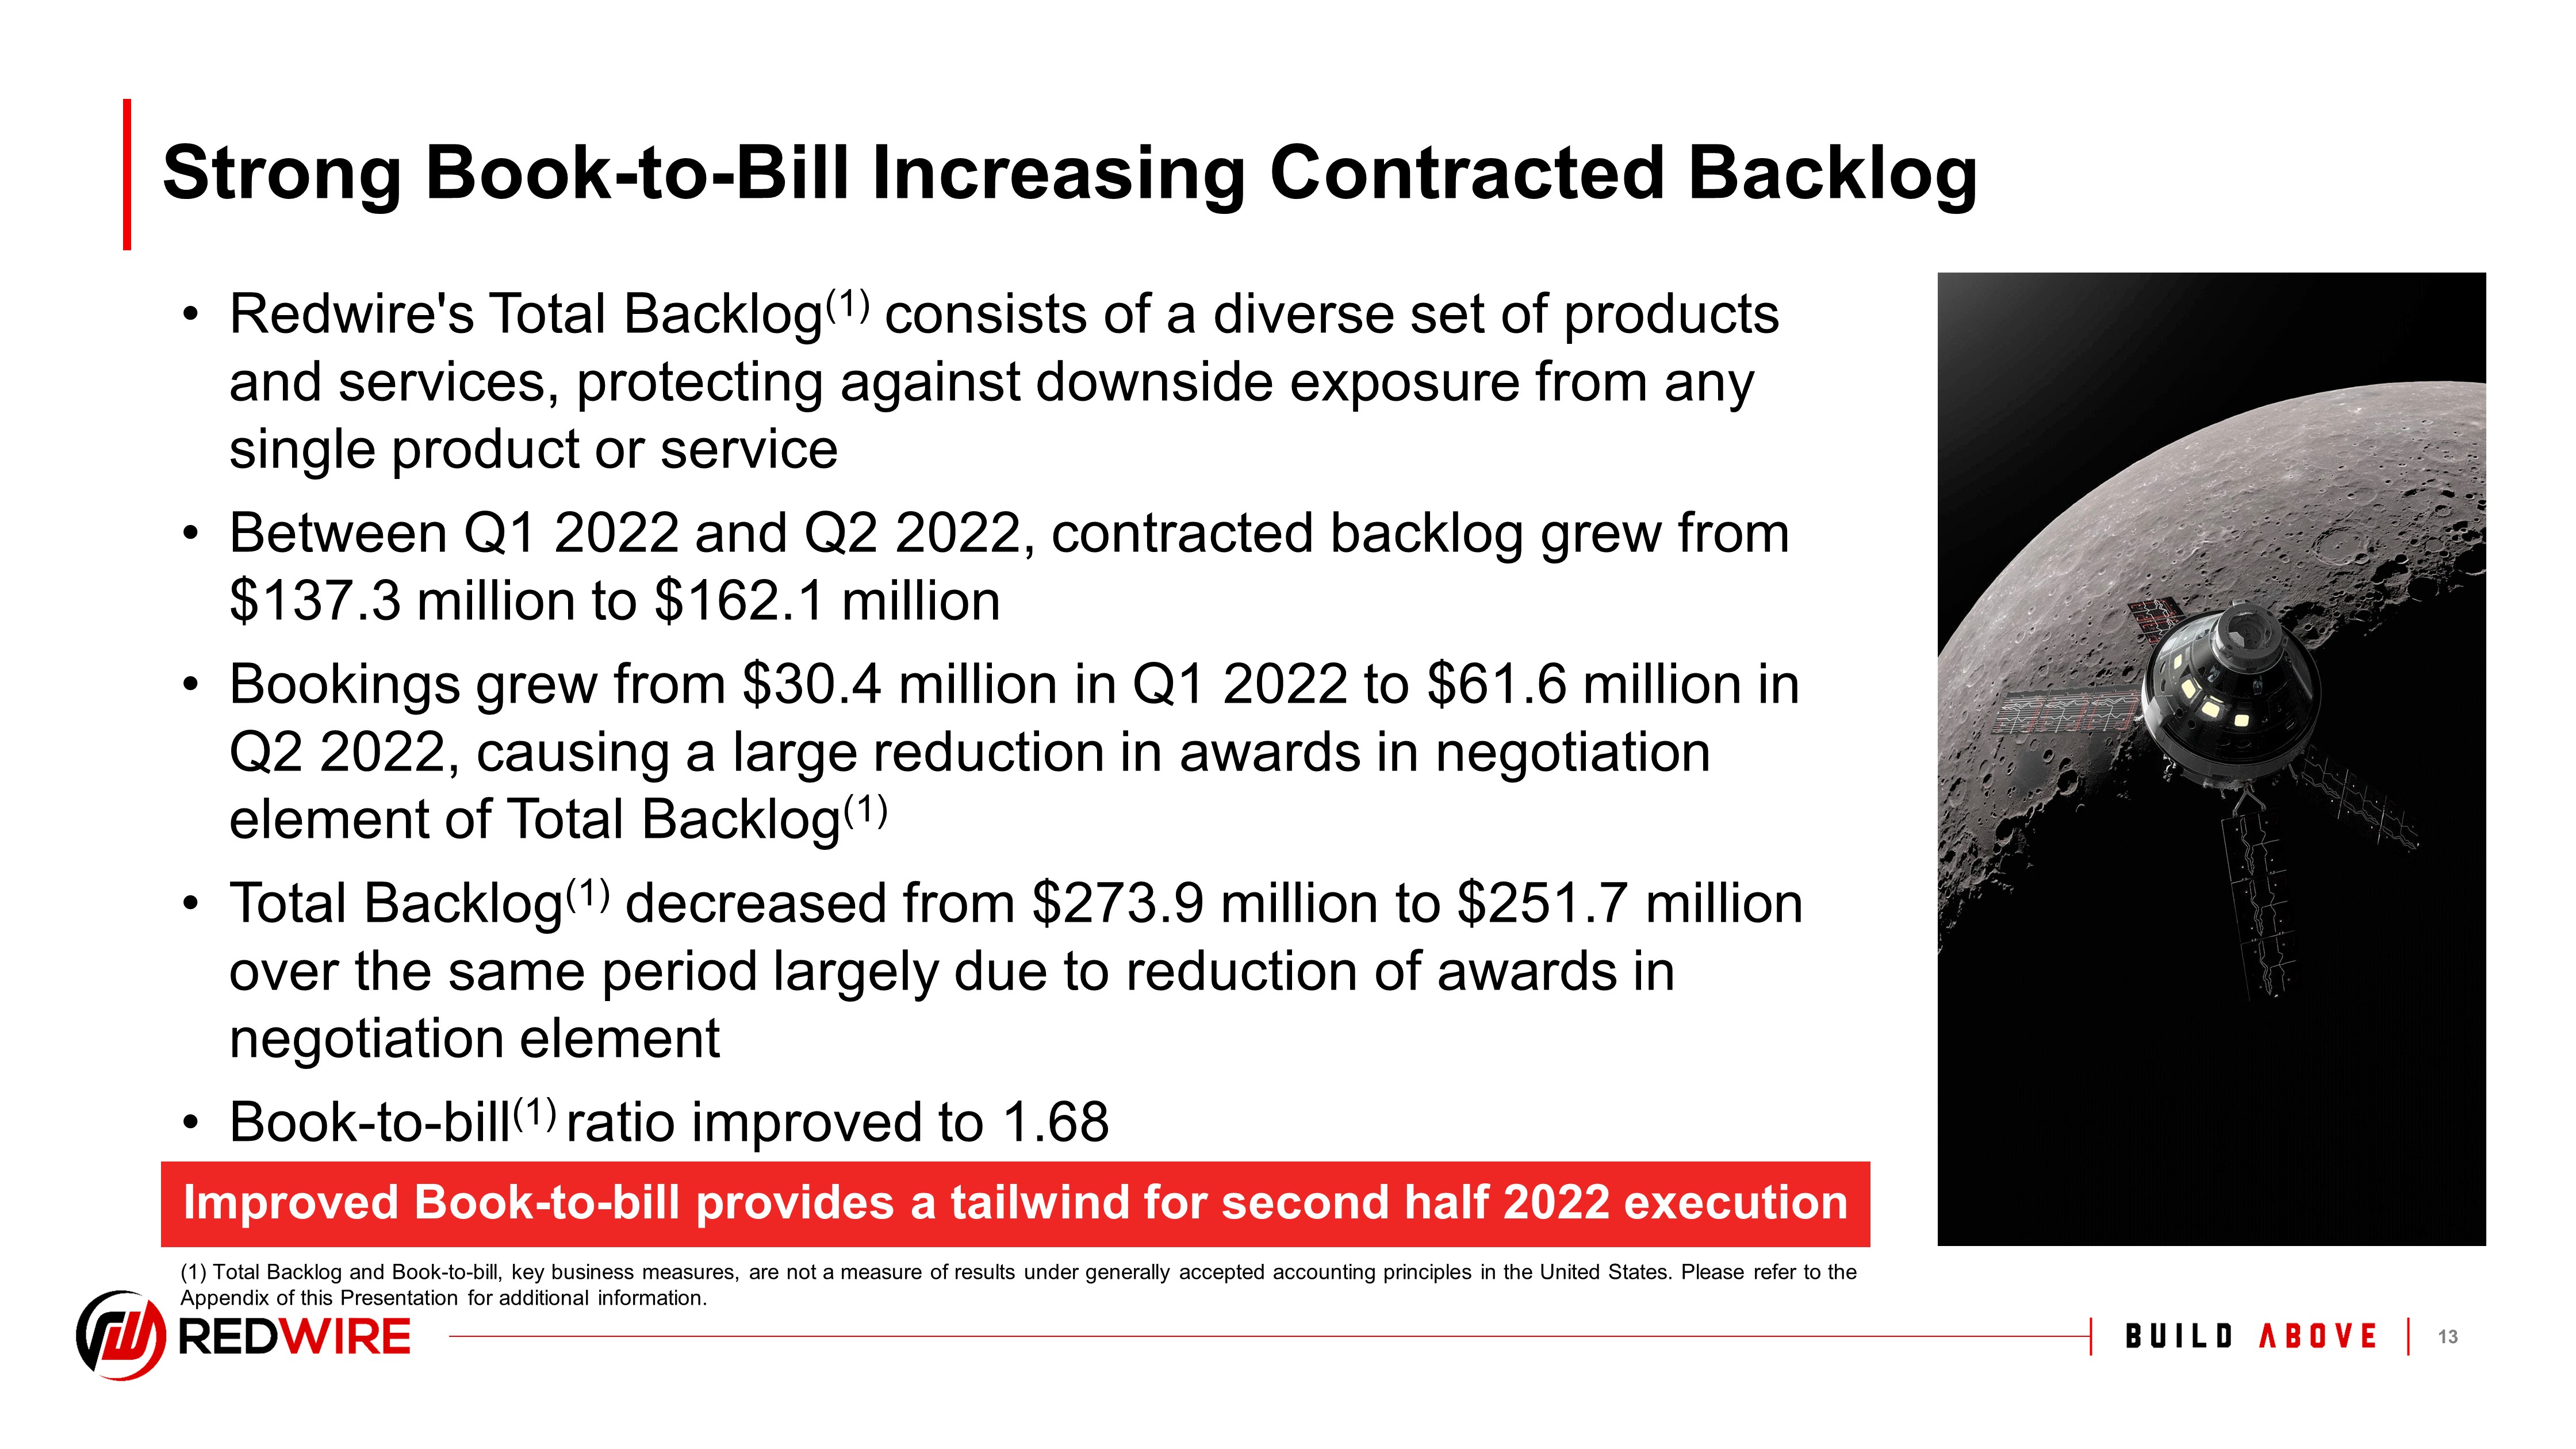
1. Insert Footnote 10 Strong Book - to - Bill Increasing Contracted Backlog • Redwire's Total Backlog (1) consists of a diverse set of products and services, protecting against downside exposure from any single product or service • Between Q1 2022 and Q2 2022, contracted backlog grew from $137.3 million to $162.1 million • Bookings grew from $30.4 million in Q1 2022 to $61.6 million in Q2 2022, causing a large reduction in awards in negotiation element of Total Backlog (1) • Total Backlog (1) decreased from $273.9 million to $251.7 million over the same period largely due to reduction of awards in negotiation element • Book - to - bill (1) ratio improved to 1.68 Improved Book - to - bill provides a tailwind for second half 2022 execution (1) Total Backlog and Book - to - bill, key business measures, are not a measure of results under generally accepted accounting prin ciples in the United States. Please refer to the Appendix of this Presentation for additional information.
1. Insert Footnote 11 Robust Pipeline Driving Increased Sales Momentum • Current pipeline is ~$3.5 billion total pipeline across ~500 opportunities • $556 million in submitted bids (up from $249 million at the end of Q1 2022) • $264 million of $556 million submitted bids have estimated selection dates in 2022 • $83 million in bids in work with estimated selection date in 2022 • Healthy mix of NSS, Civil, and Commercial increases robustness of order book while providing many opportunities for accelerating growth High fidelity on near - term pipeline providing confidence in bookings and Total Backlog growth in second half 2022 and into 2023 (Amounts as of June 30, 2022, unless otherwise stated)
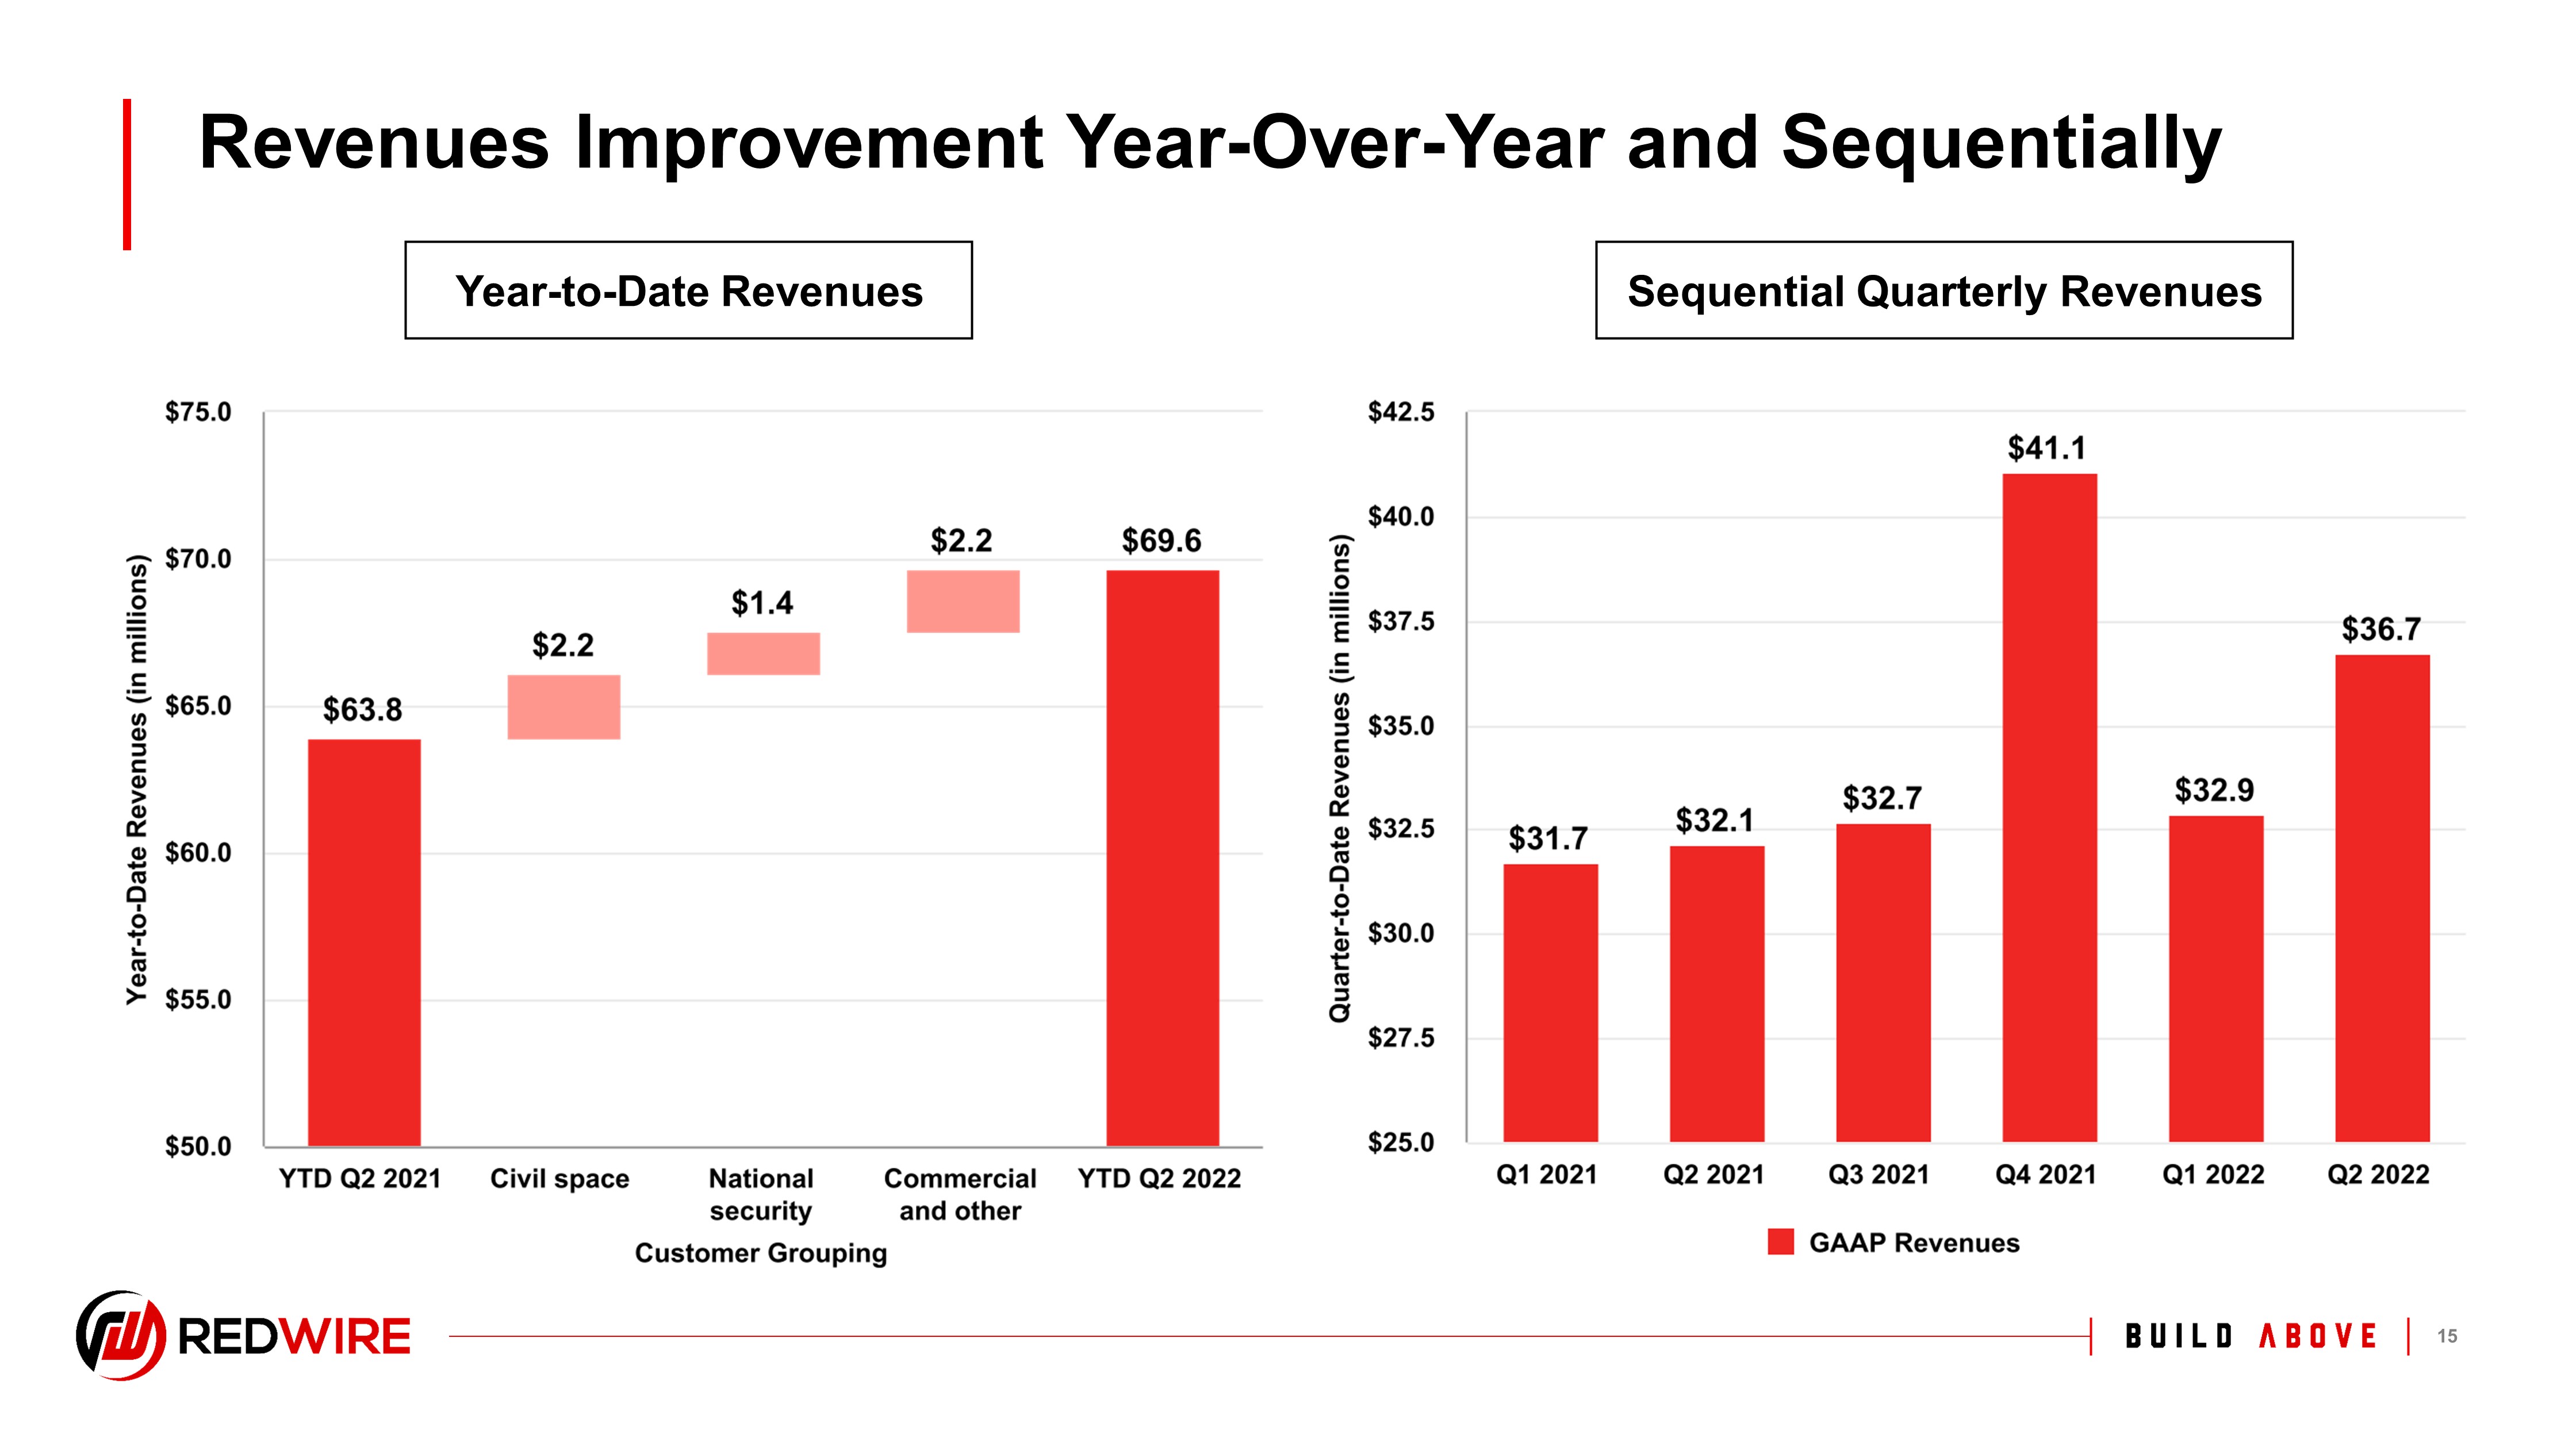
1. Insert Footnote 12 Revenues Improvement Year - Over - Year and Sequentially Year - to - Date Revenues Sequential Quarterly Revenues
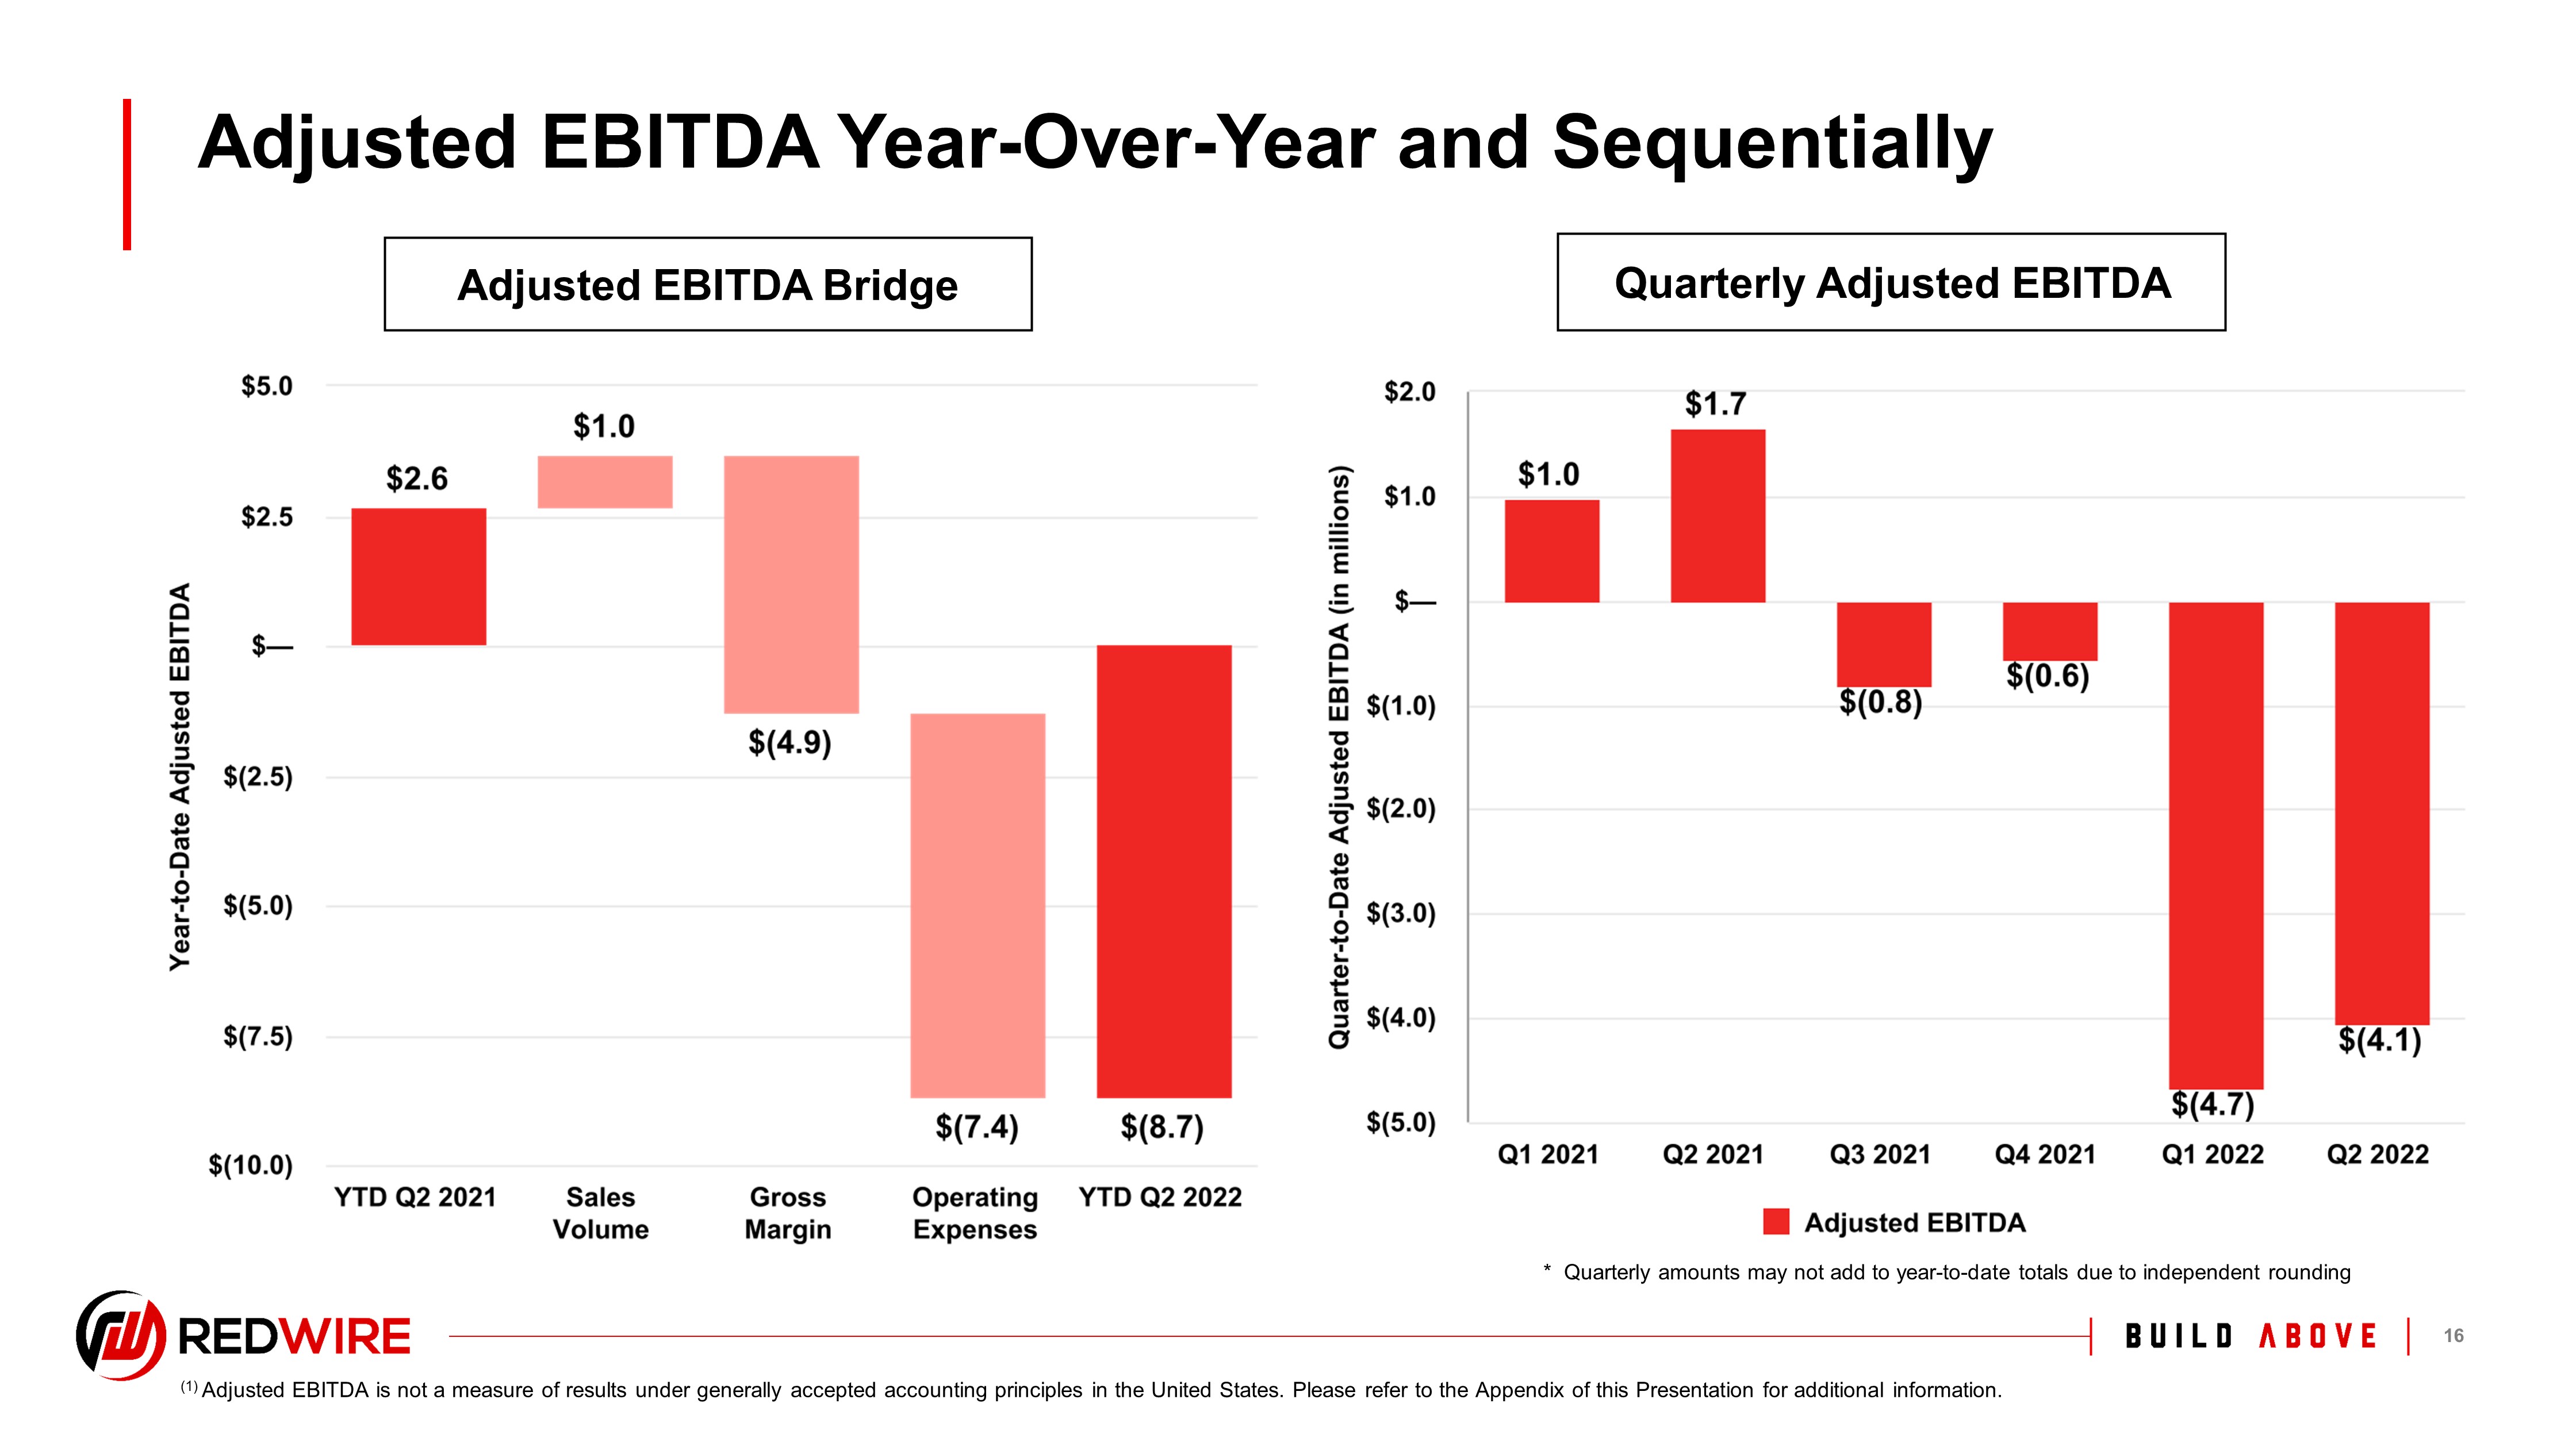
1. Insert Footnote 13 Adjusted EBITDA Year - Over - Year and Sequentially Quarterly Adjusted EBITDA Adjusted EBITDA Bridge (1) Adjusted EBITDA is not a measure of results under generally accepted accounting principles in the United States. Please refer to the Appendix of this Presentation for additional information. * Quarterly amounts may not add to year - to - date totals due to independent rounding
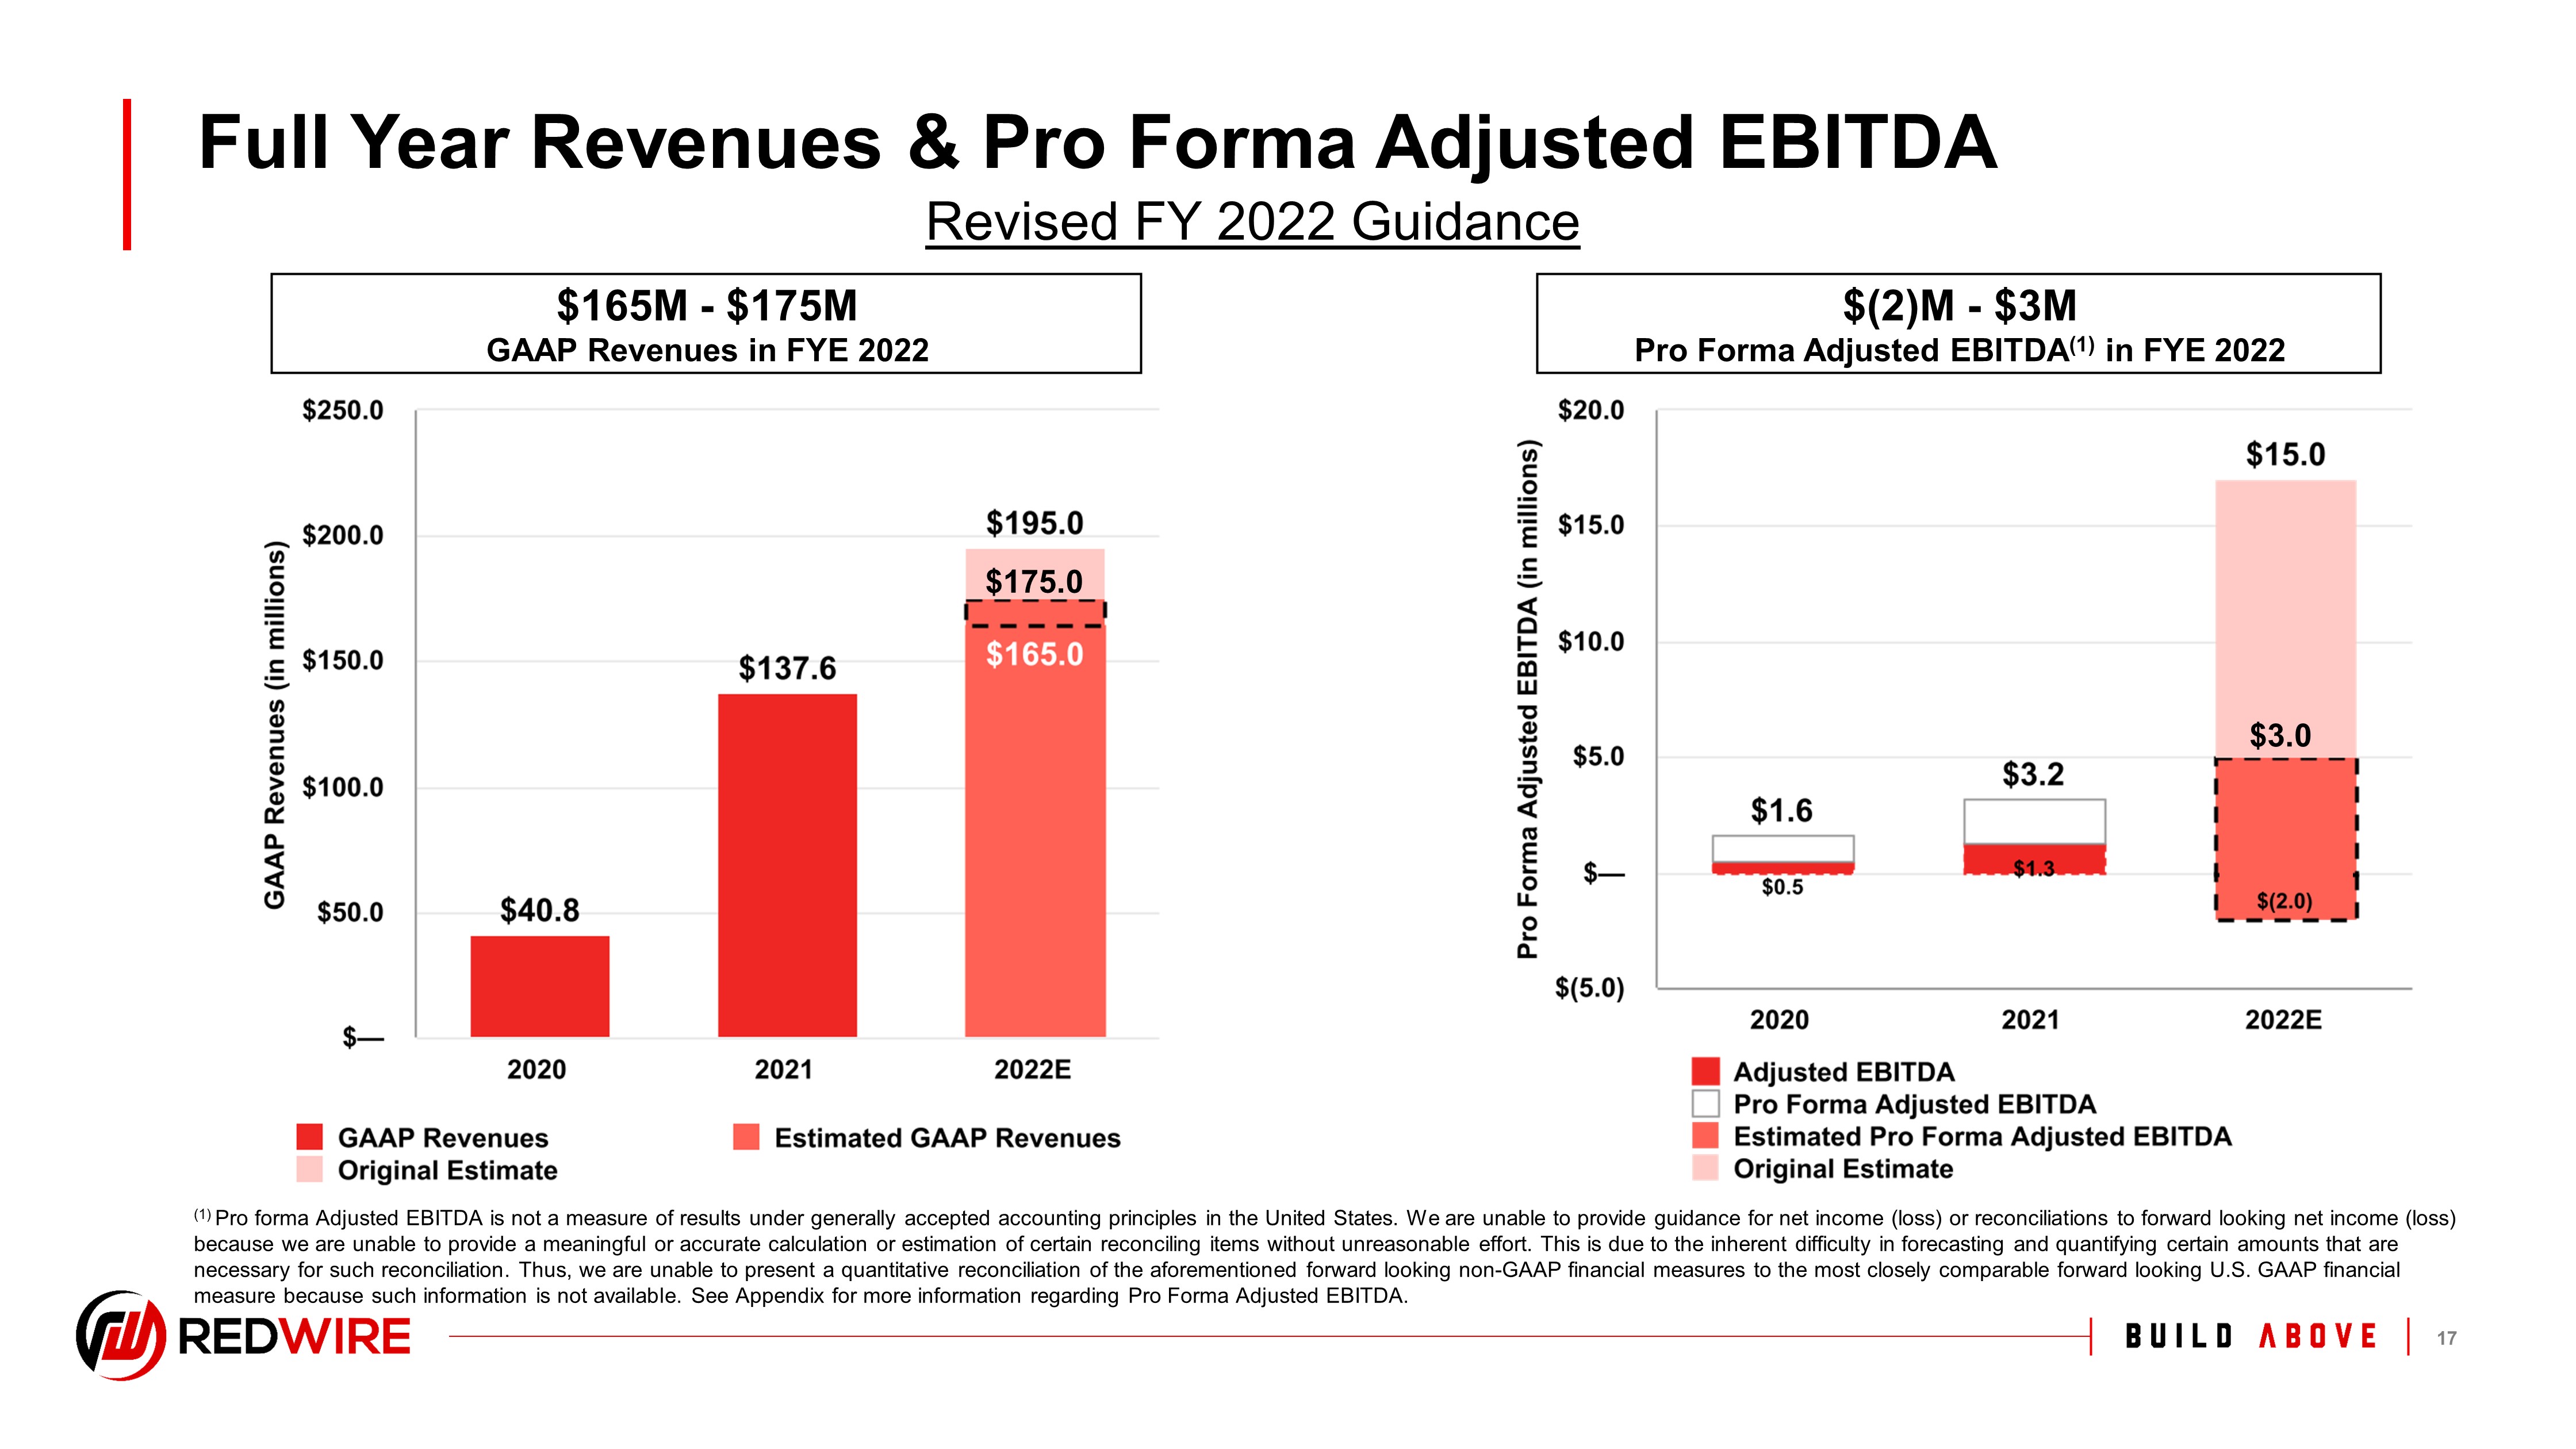
1. Insert Footnote 14 $165M - $175M GAAP Revenues in FYE 2022 $(2)M - $3M Pro Forma Adjusted EBITDA (1) in FYE 2022 Full Year Revenues & Pro Forma Adjusted EBITDA Revised FY 2022 Guidance (1) Pro forma Adjusted EBITDA is not a measure of results under generally accepted accounting principles in the United States. We ar e unable to provide guidance for net income (loss) or reconciliations to forward looking net income (loss) because we are unable to provide a meaningful or accurate calculation or estimation of certain reconciling items without unre aso nable effort. This is due to the inherent difficulty in forecasting and quantifying certain amounts that are necessary for such reconciliation. Thus, we are unable to present a quantitative reconciliation of the aforementioned forward lo oking non - GAAP financial measures to the most closely comparable forward looking U.S. GAAP financial measure because such information is not available. See Appendix for more information regarding Pro Forma Adjusted EBITDA. $175.0 $3.0
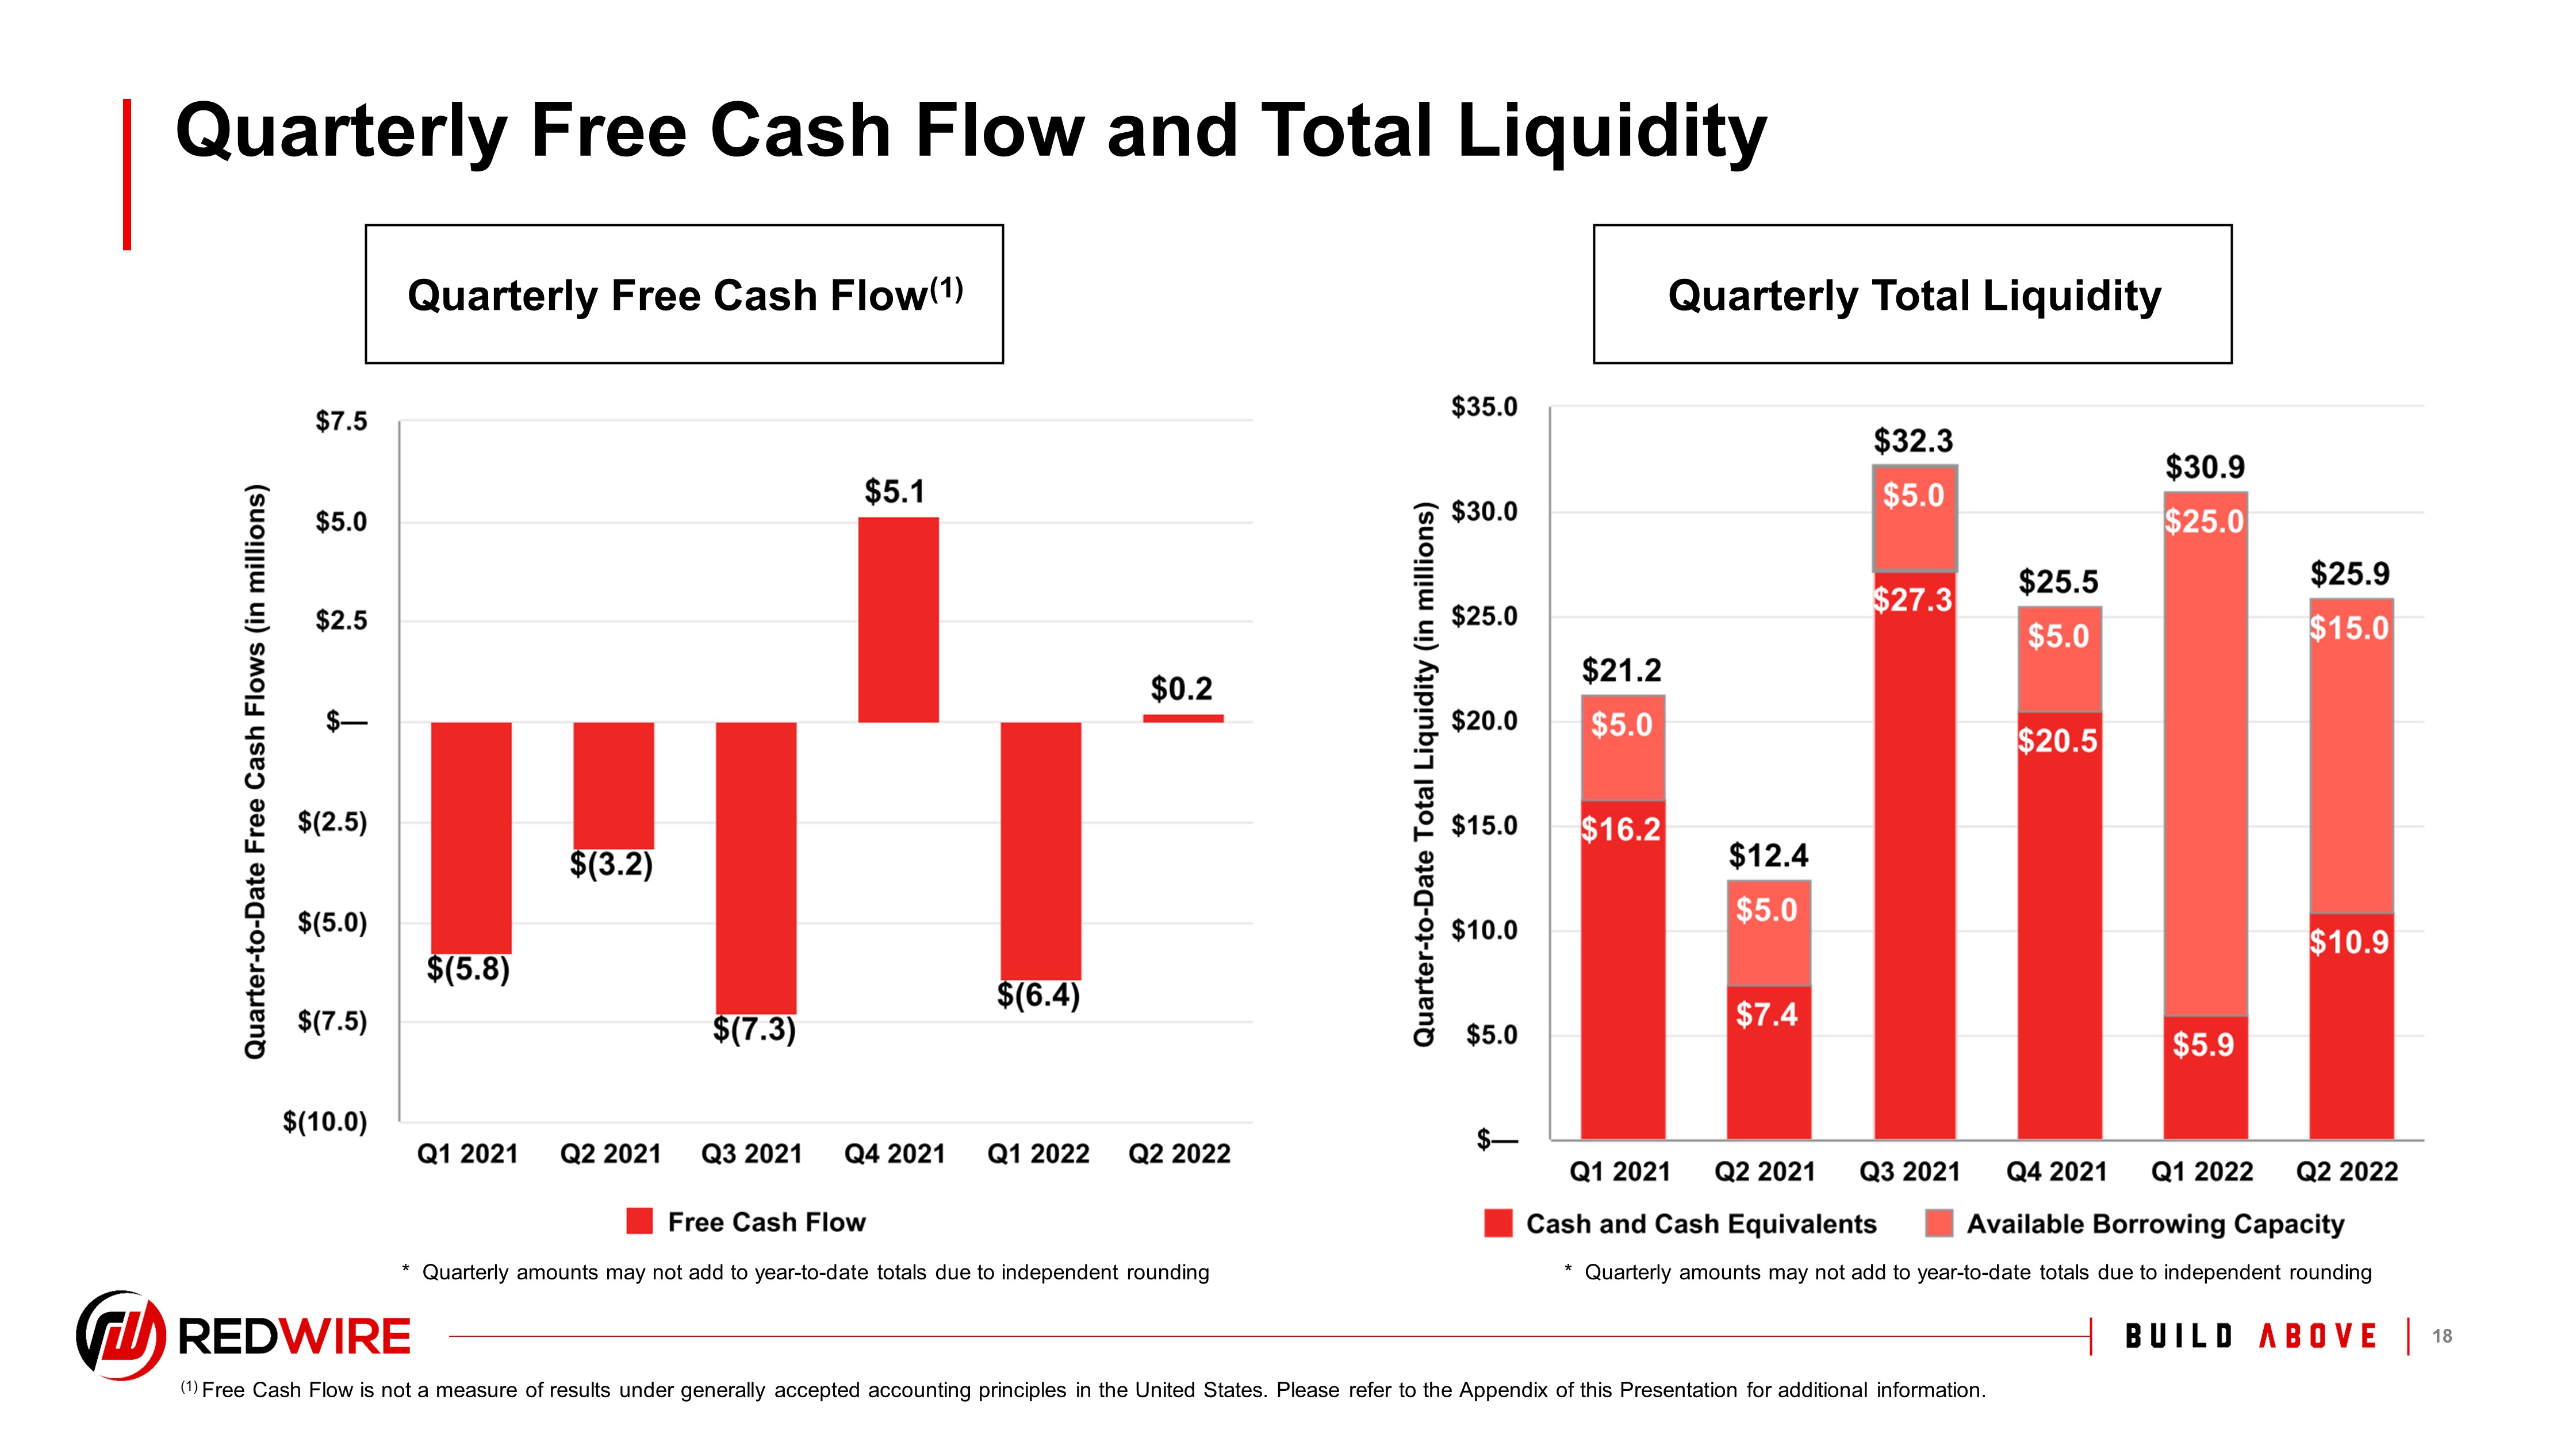
1. Insert Footnote 15 Quarterly Free Cash Flow and Total Liquidity Quarterly Free Cash Flow (1) Quarterly Total Liquidity (1) Free Cash Flow is not a measure of results under generally accepted accounting principles in the United States. Please refer to the Appendix of this Presentation for additional information. * Quarterly amounts may not add to year - to - date totals due to independent rounding * Quarterly amounts may not add to year - to - date totals due to independent rounding
1. Insert Footnote 16 • Strong market demand is continuing to present numerous high potential and high topline opportunities due to an increasing geo - political competition for dominance in space across civil, commercial and national security domains • Our proven technology is not dependent on "build it and they will come" science. We are generating value - added products for our customers now as they launch in 2022 • Redwire continues to make investments in business development and R&D that have helped expand the size of program opportunities but have impacted our Adjusted EBITDA (1) for the first half of 2022 • Our second - half revenue growth, underpinned by the significantly higher 1.68 book - to bill ratio (2) and combined with changes in contract mix with higher gross margins, provides for an improved outlook for the second half of 2022 and 2023 Building a Foundation for Near - Term Improvement and Long - Term Growth As revenue and operating leverage improve sequentially, Redwire expects our financial outlook to improve (1) Adjusted EBITDA is not a measure of results under generally accepted accounting principles in the United States. Please refer to the Appendix of this Presentation for additional information. (2) Total book - to - bill, key business measures, is not a measure of results under generally accepted accounting principles in the Uni ted States. Please refer to the Appendix of this Presentation for additional information.

1. Insert Footnote 17 Appendix
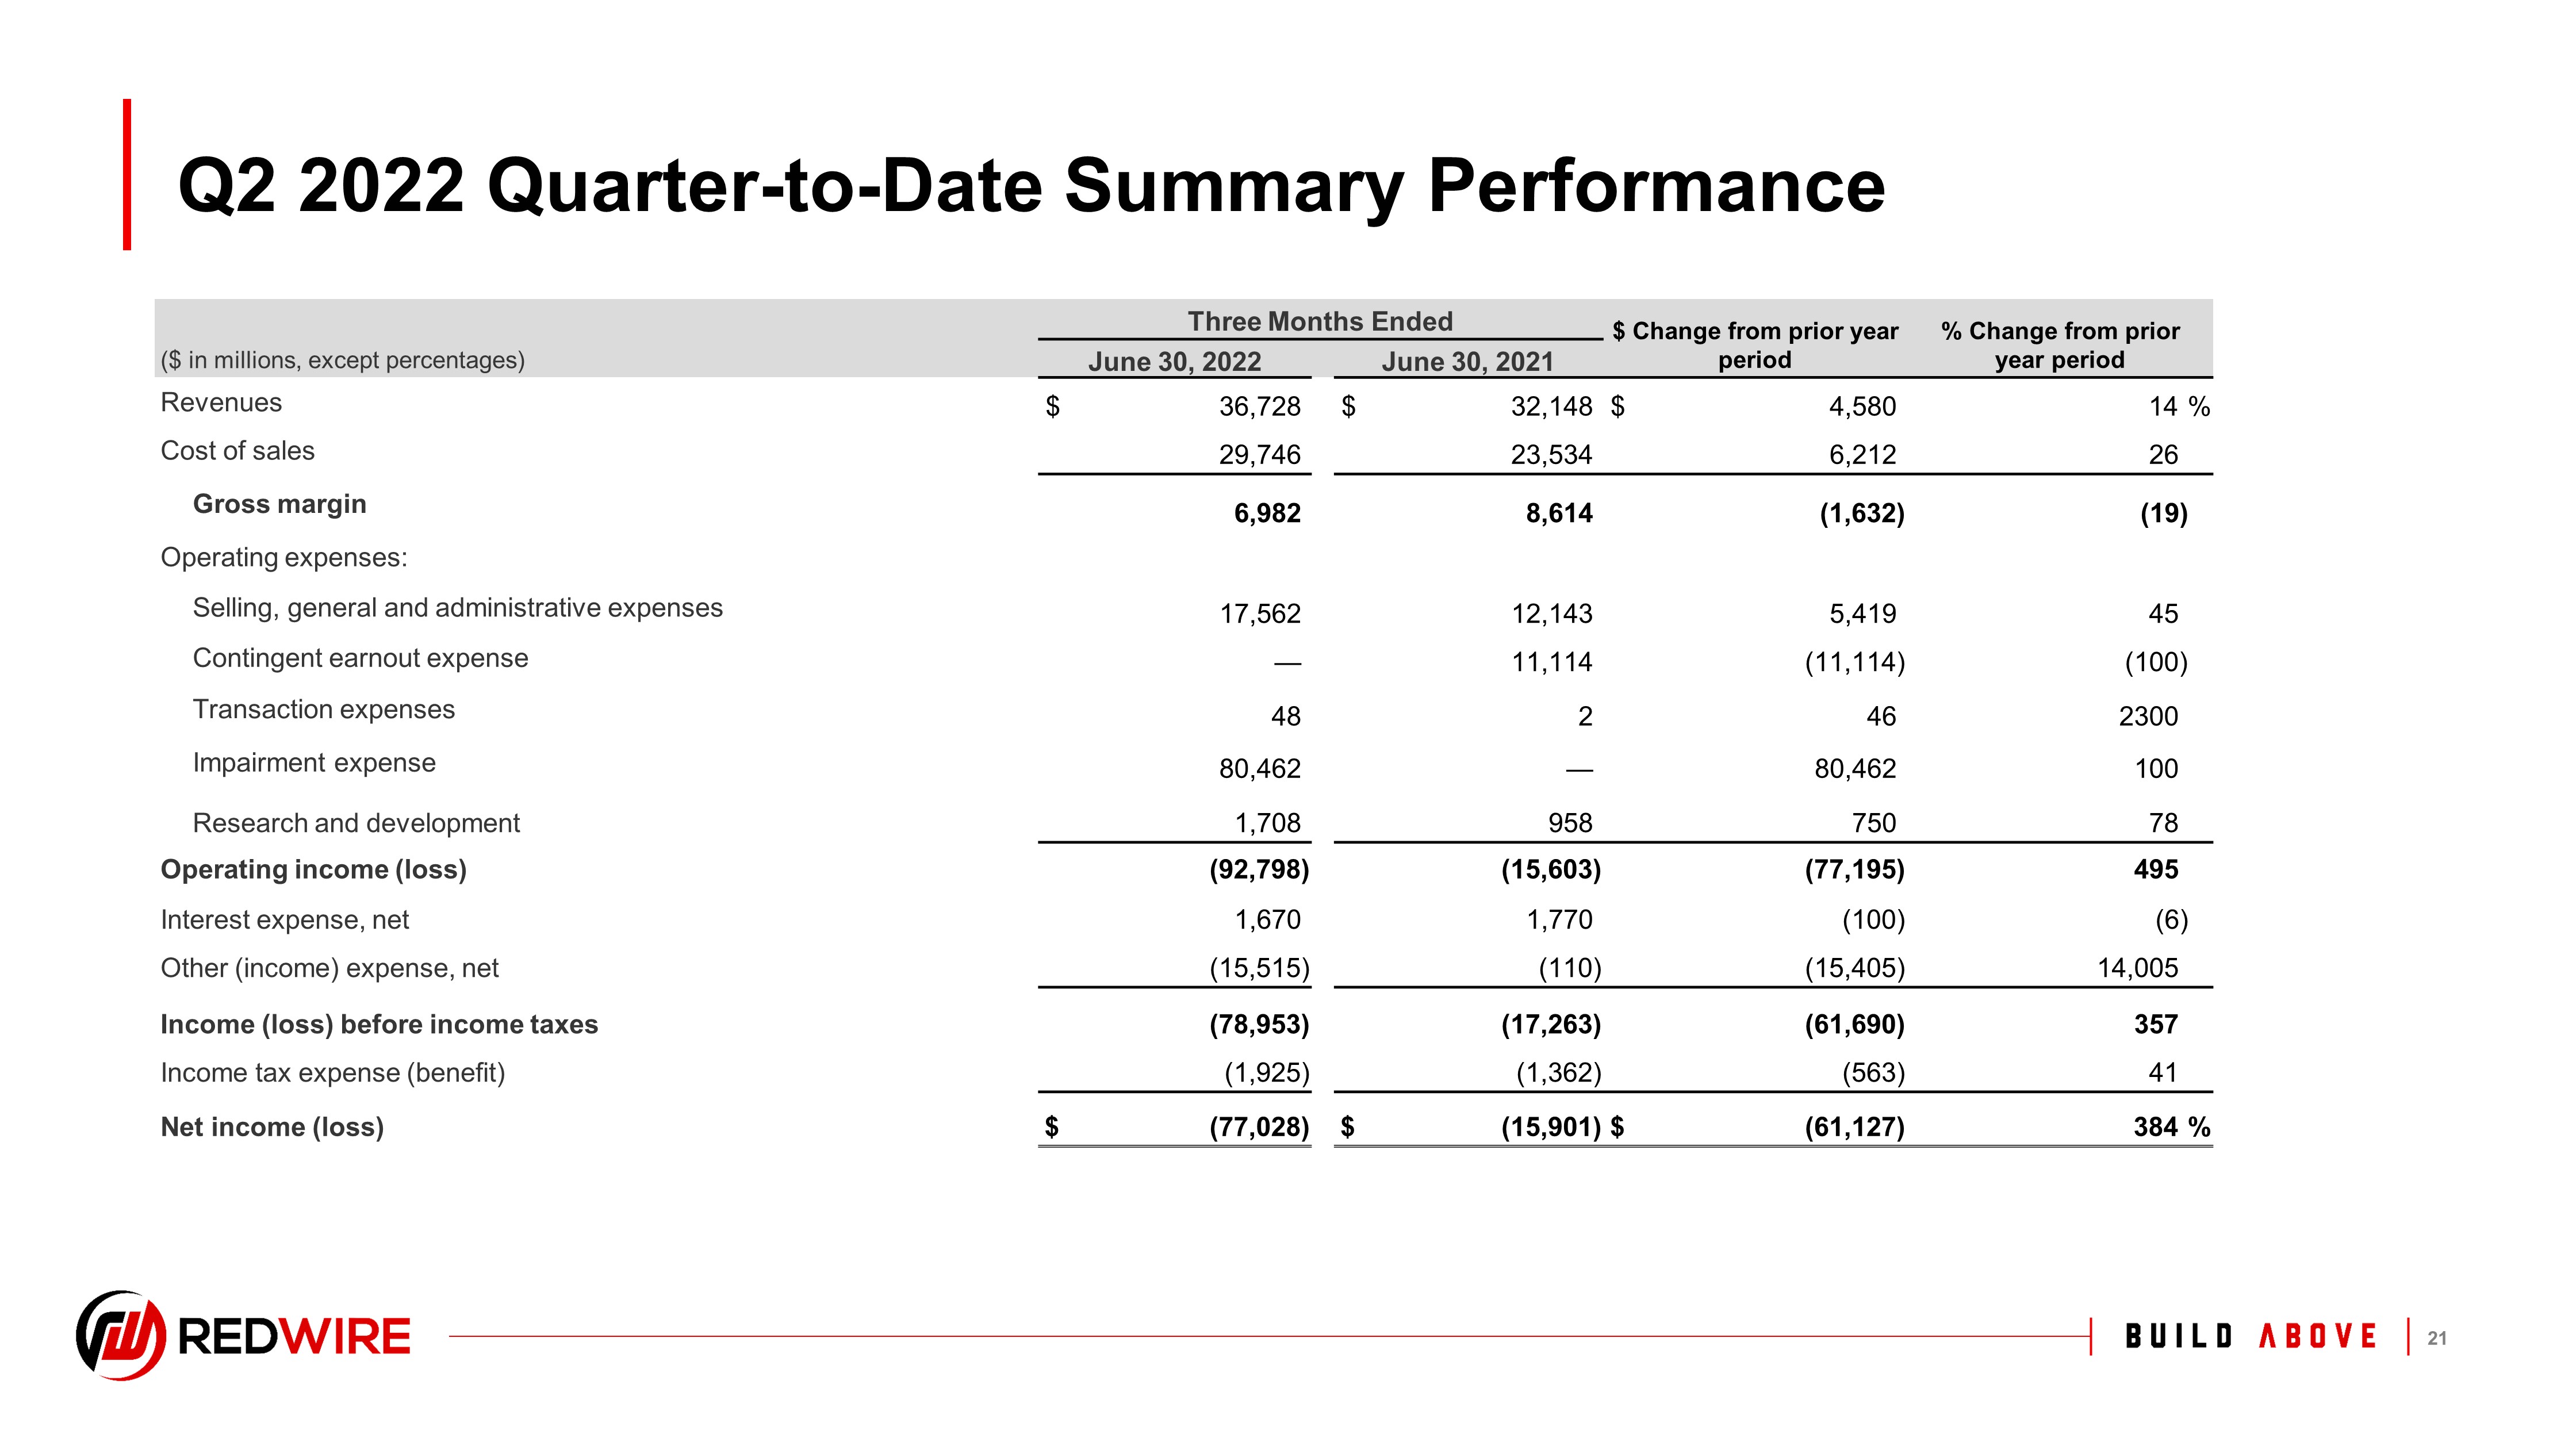
1. Insert Footnote 18 Three Months Ended $ Change from prior year period % Change from prior year period ($ in millions, except percentages) June 30, 2022 June 30, 2021 Revenues $ 36,728 $ 32,148 $ 4,580 14 % Cost of sales 29,746 23,534 6,212 26 Gross margin 6,982 8,614 (1,632) (19) Operating expenses: Selling, general and administrative expenses 17,562 12,143 5,419 45 Contingent earnout expense — 11,114 (11,114) (100) Transaction expenses 48 2 46 2300 Impairment expense 80,462 — 80,462 100 Research and development 1,708 958 750 78 Operating income (loss) (92,798) (15,603) (77,195) 495 Interest expense, net 1,670 1,770 (100) (6) Other (income) expense, net (15,515) (110) (15,405) 14,005 Income (loss) before income taxes (78,953) (17,263) (61,690) 357 Income tax expense (benefit) (1,925) (1,362) (563) 41 Net income (loss) $ (77,028) $ (15,901) $ (61,127) 3 84 % Q2 2022 Quarter - to - Date Summary Performance
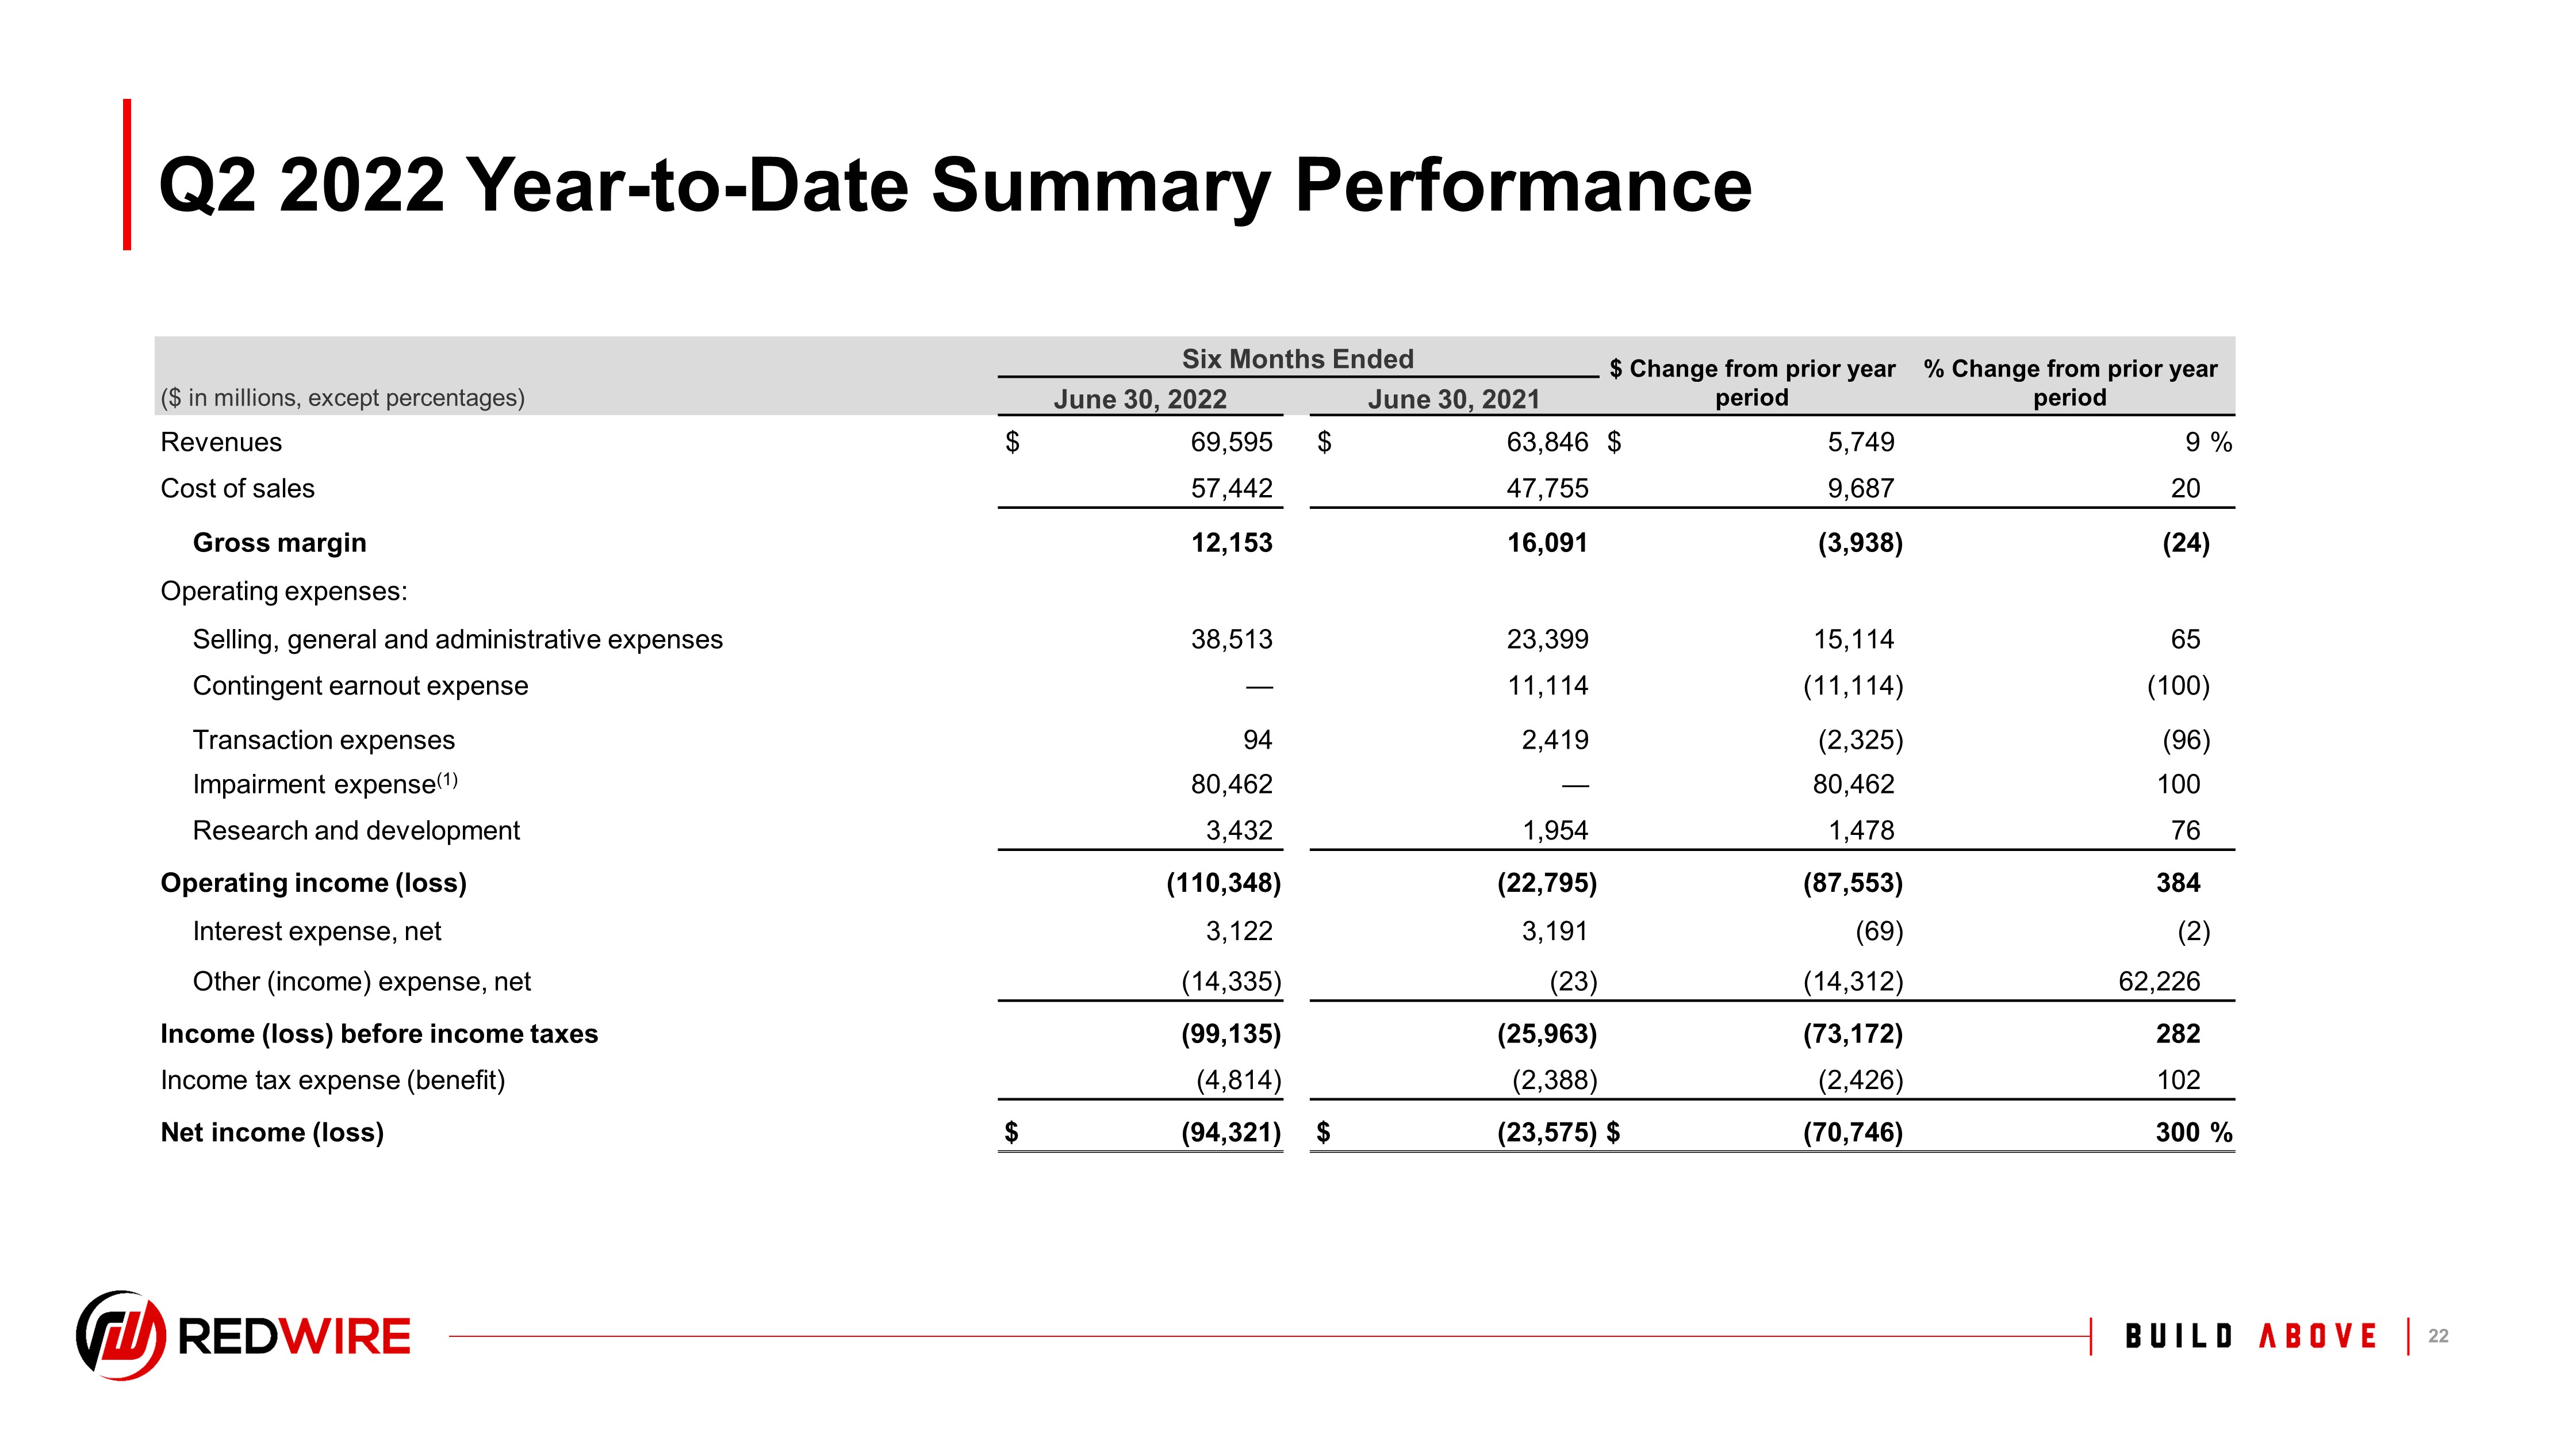
1. Insert Footnote Q2 2022 Year - to - Date Summary Performance 19 Six Months Ended $ Change from prior year period % Change from prior year period ($ in millions, except percentages) June 30, 2022 June 30, 2021 Revenues $ 69,595 $ 63,846 $ 5,749 9 % Cost of sales 57,442 47,755 9,687 20 Gross margin 12,153 16,091 (3,938) (24) Operating expenses: Selling, general and administrative expenses 38,513 23,399 15,114 65 Contingent earnout expense — 11,114 (11,114) (100) Transaction expenses 94 2,419 (2,325) (96) Impairment expense (1) 80,462 — 80,462 100 Research and development 3,432 1,954 1,478 76 Operating income (loss) (110,348) (22,795) (87,553) 384 Interest expense, net 3,122 3,191 (69) (2) Other (income) expense, net (14,335) (23) (14,312) 62,226 Income (loss) before income taxes (99,135) (25,963) (73,172) 282 Income tax expense (benefit) (4,814) (2,388) (2,426) 102 Net income (loss) $ (94,321) $ (23,575) $ (70,746) 300 %
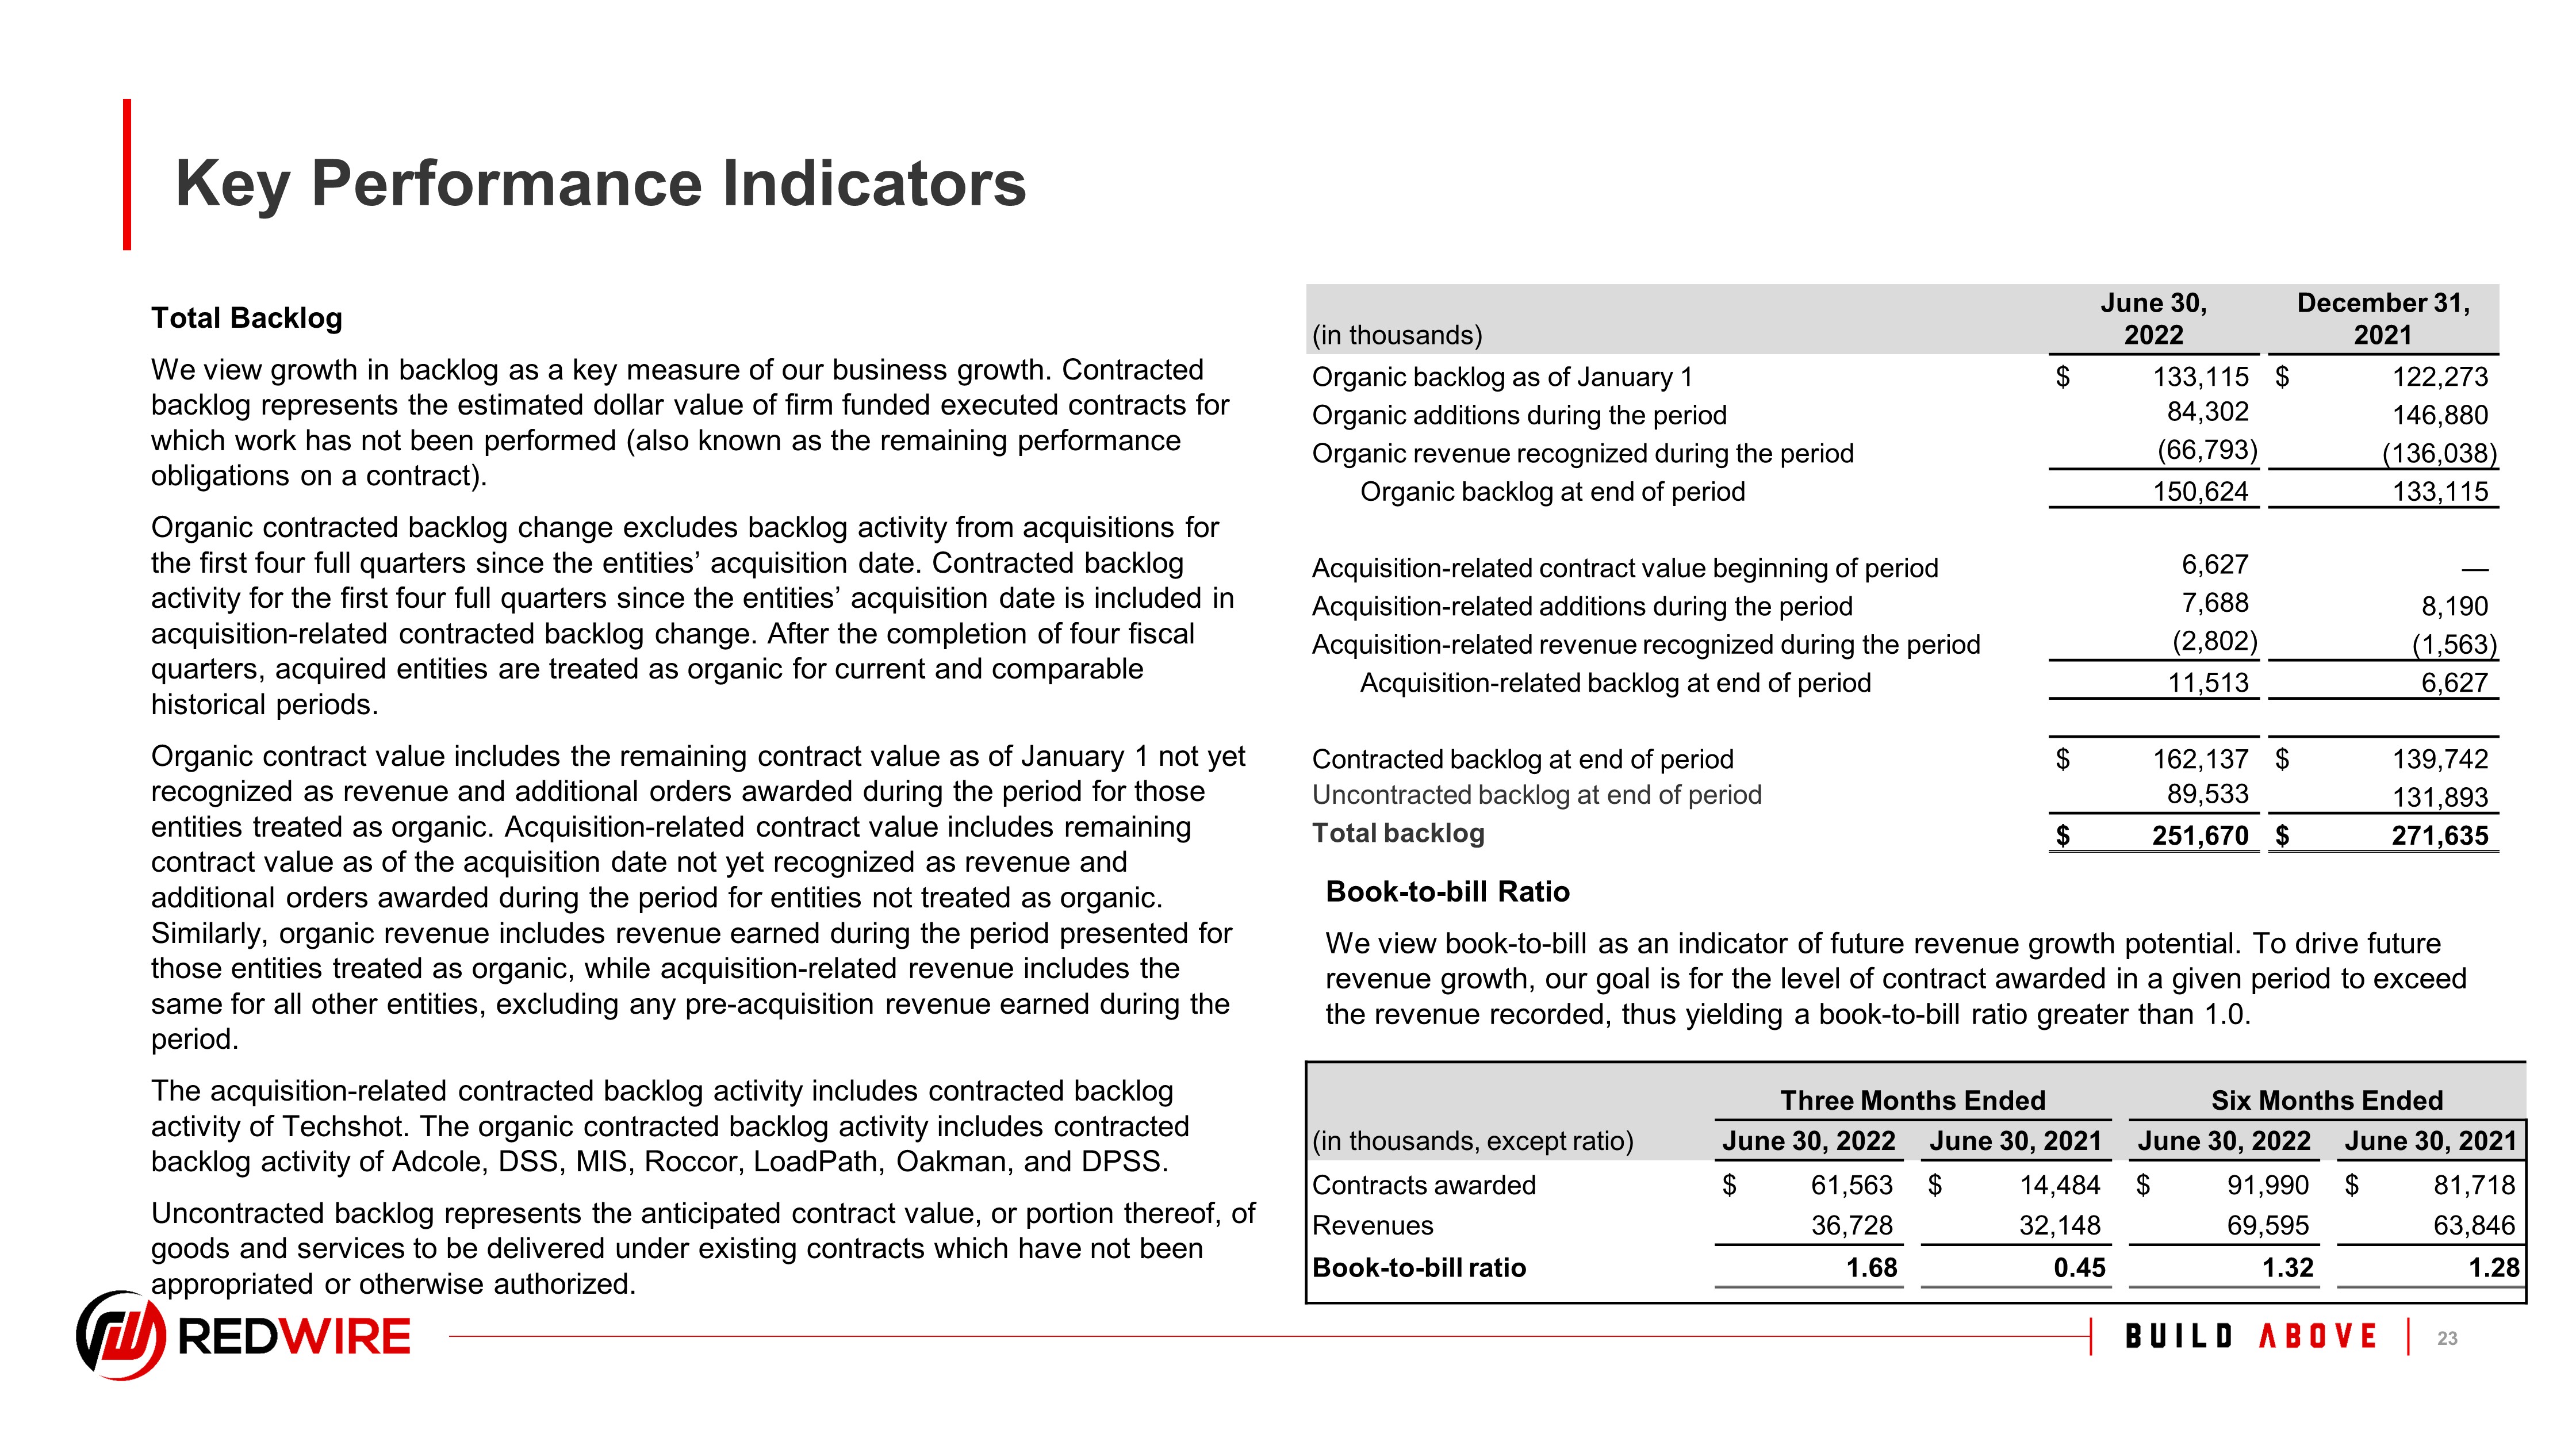
1. Insert Footnote Total Backlog We view growth in backlog as a key measure of our business growth. Contracted backlog represents the estimated dollar value of firm funded executed contracts for which work has not been performed (also known as the remaining performance obligations on a contract). Organic contracted backlog change excludes backlog activity from acquisitions for the first four full quarters since the entities’ acquisition date. Contracted backlog activity for the first four full quarters since the entities’ acquisition date is included in acquisition - related contracted backlog change. After the completion of four fiscal quarters, acquired entities are treated as organic for current and comparable historical periods. Organic contract value includes the remaining contract value as of January 1 not yet recognized as revenue and additional orders awarded during the period for those entities treated as organic. Acquisition - related contract value includes remaining contract value as of the acquisition date not yet recognized as revenue and additional orders awarded during the period for entities not treated as organic. Similarly, organic revenue includes revenue earned during the period presented for those entities treated as organic, while acquisition - related revenue includes the same for all other entities, excluding any pre - acquisition revenue earned during the period. The acquisition - related contracted backlog activity includes contracted backlog activity of Techshot. The organic contracted backlog activity includes contracted backlog activity of Adcole, DSS, MIS, Roccor, LoadPath, Oakman, and DPSS. Uncontracted backlog represents the anticipated contract value, or portion thereof, of goods and services to be delivered under existing contracts which have not been appropriated or otherwise authorized. Key Performance Indicators 20 (in thousands) June 30, 2022 December 31, 2021 Organic backlog as of January 1 $ 133,115 $ 122,273 Organic additions during the period 84,302 146,880 Organic revenue recognized during the period (66,793) (136,038) Organic backlog at end of period 150,624 133,115 Acquisition - related contract value beginning of period 6,627 — Acquisition - related additions during the period 7,688 8,190 Acquisition - related revenue recognized during the period (2,802) (1,563) Acquisition - related backlog at end of period 11,513 6,627 Contracted backlog at end of period $ 162,137 $ 139,742 Uncontracted backlog at end of period 89,533 131,893 Total backlog $ 251,670 $ 271,635 Three Months Ended Six Months Ended (in thousands, except ratio) June 30, 2022 June 30, 2021 June 30, 2022 June 30, 2021 Contracts awarded $ 61,563 $ 14,484 $ 91,990 $ 81,718 Revenues 36,728 32,148 69,595 63,846 Book - to - bill ratio 1.68 0.45 1.32 1.28 Book - to - bill Ratio We view book - to - bill as an indicator of future revenue growth potential. To drive future revenue growth, our goal is for the level of contract awarded in a given period to exceed the revenue recorded, thus yielding a book - to - bill ratio greater than 1.0.
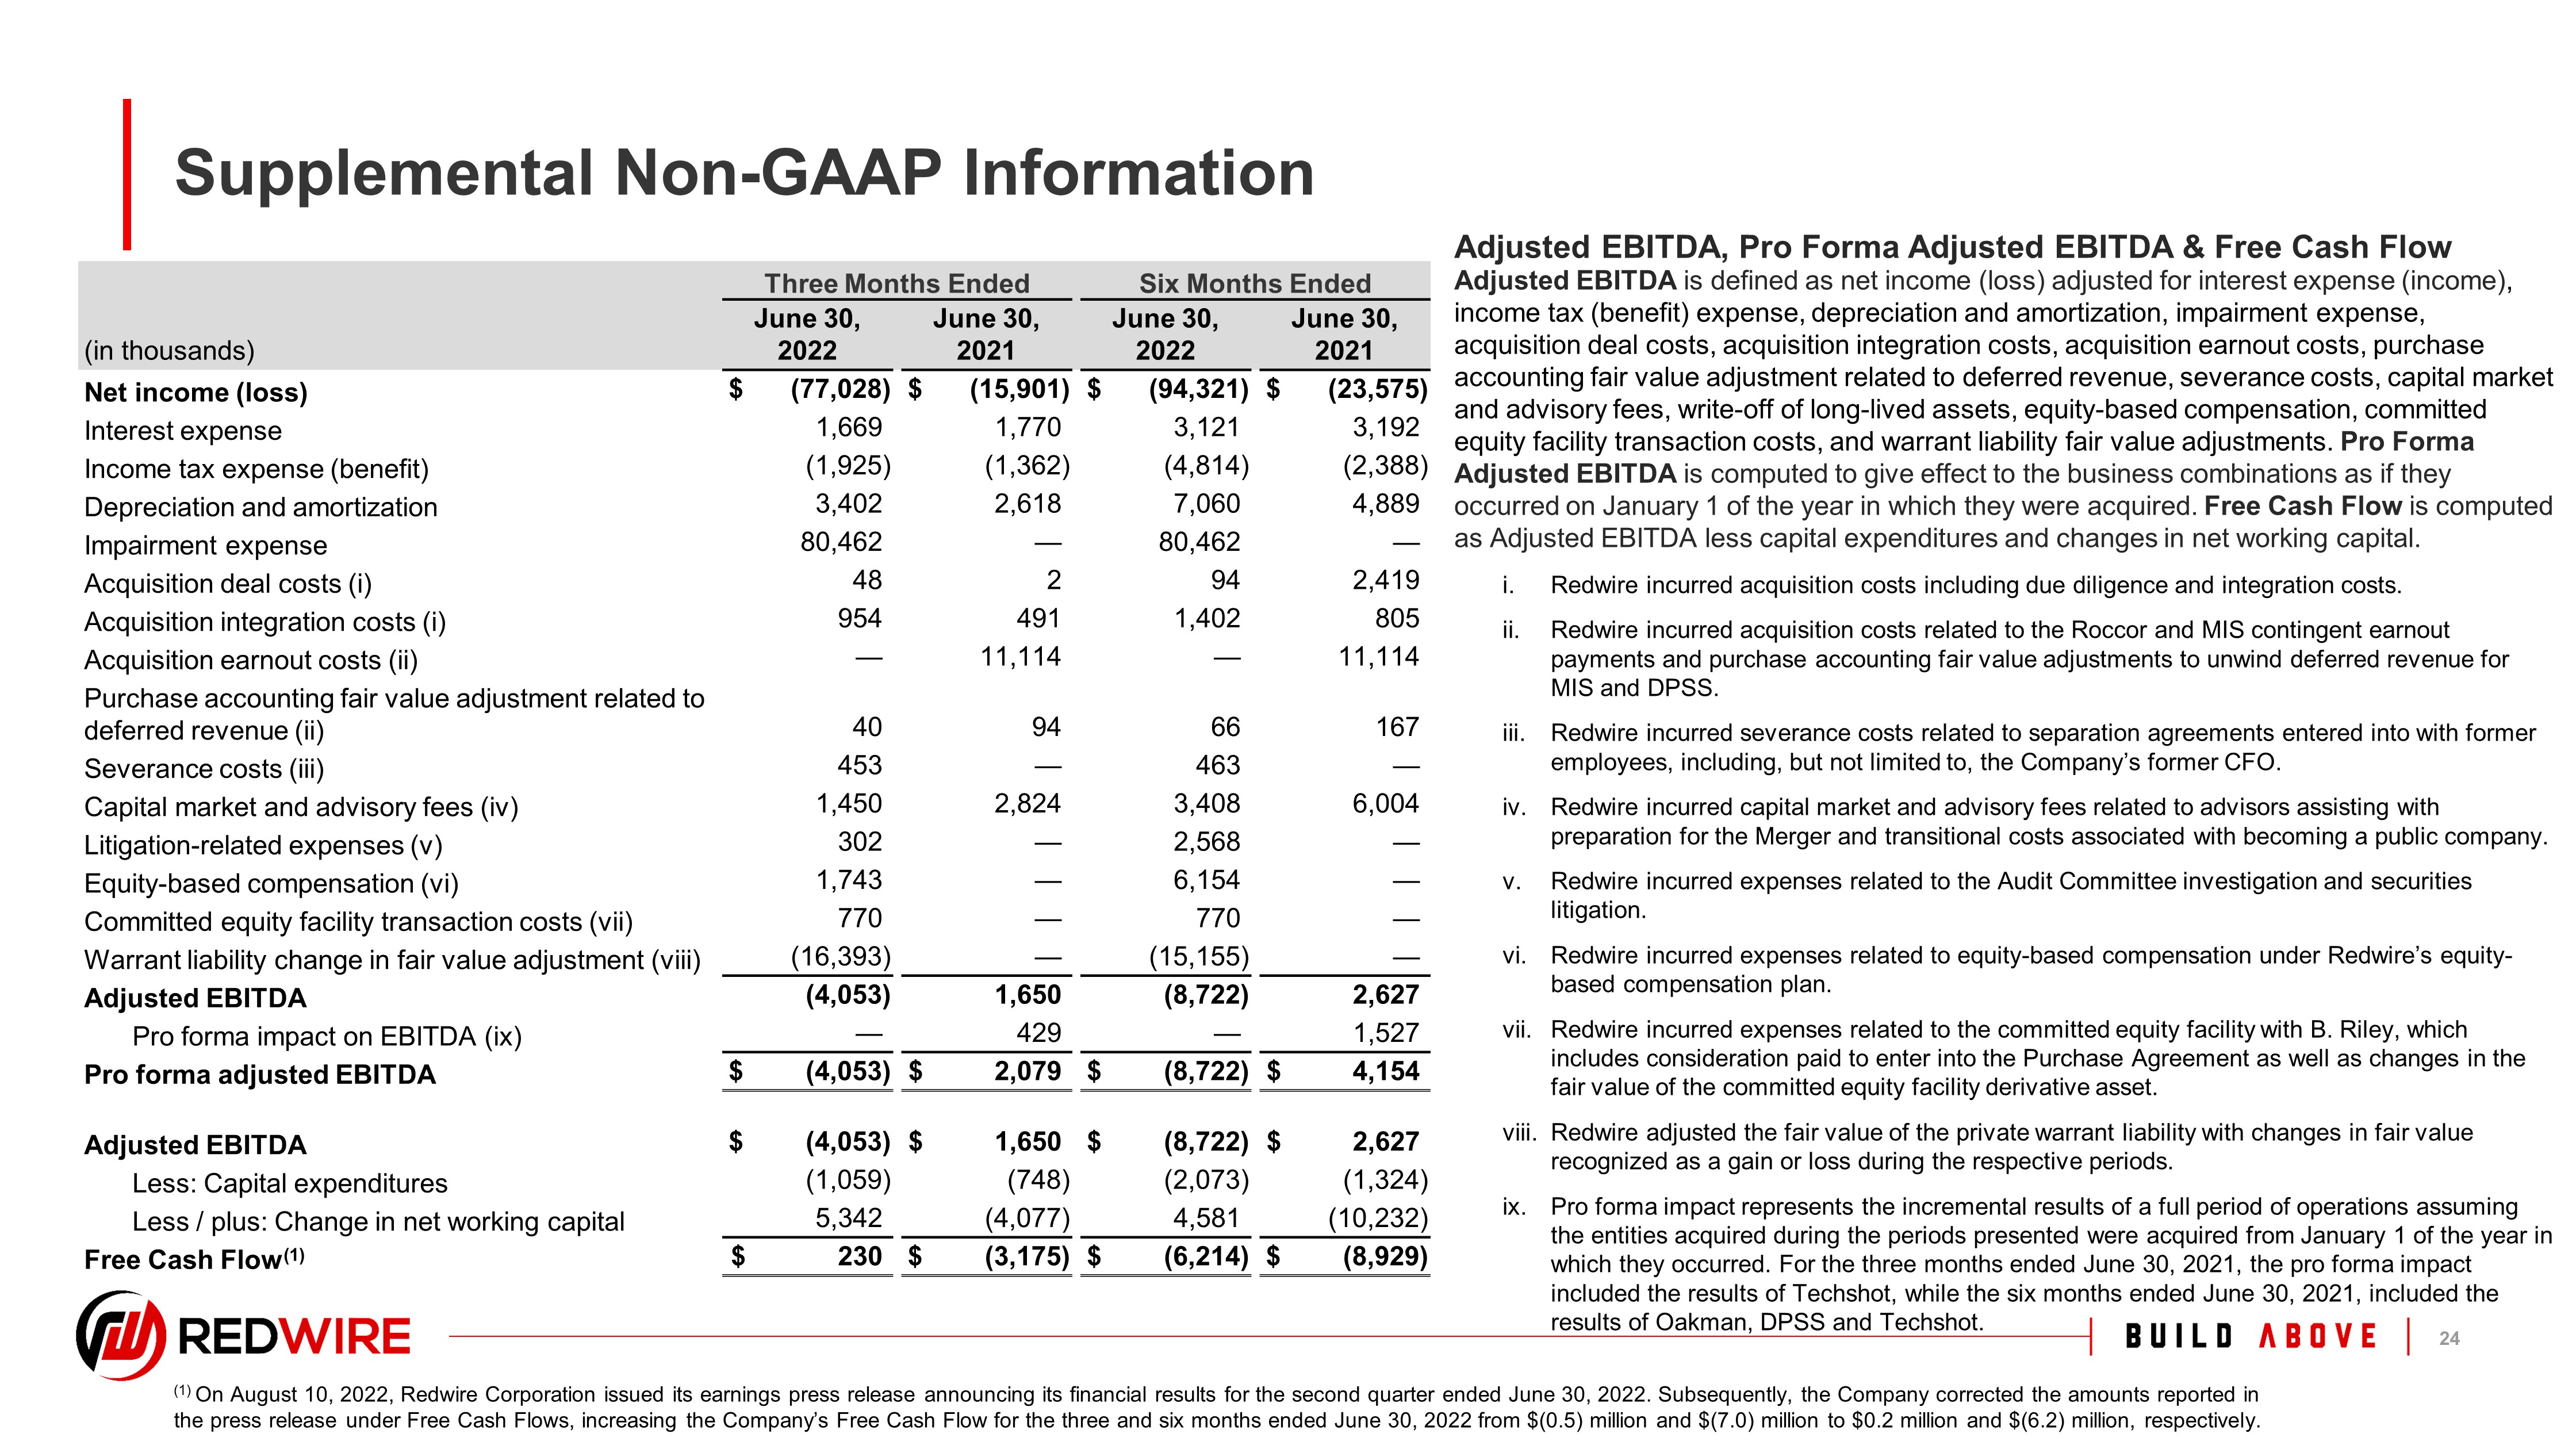
1. Insert Footnote Supplemental Non - GAAP Information 21 Adjusted EBITDA, Pro Forma Adjusted EBITDA & Free Cash Flow Three Months Ended Six Months Ended (in thousands) June 30, 2022 June 30, 2021 June 30, 2022 June 30, 2021 Net income (loss) $ (77,028) $ (15,901) $ (94,321) $ (23,575) Interest expense 1,669 1,770 3,121 3,192 Income tax expense (benefit) (1,925) (1,362) (4,814) (2,388) Depreciation and amortization 3,402 2,618 7,060 4,889 Impairment expense 80,462 — 80,462 — Acquisition deal costs (i) 48 2 94 2,419 Acquisition integration costs (i) 954 491 1,402 805 Acquisition earnout costs (ii) — 11,114 — 11,114 Purchase accounting fair value adjustment related to deferred revenue (ii) 40 94 66 167 Severance costs (iii) 453 — 463 — Capital market and advisory fees (iv) 1,450 2,824 3,408 6,004 Litigation - related expenses (v) 302 — 2,568 — Equity - based compensation (vi) 1,743 — 6,154 — Committed equity facility transaction costs (vii) 770 — 770 — Warrant liability change in fair value adjustment (viii) (16,393) — (15,155) — Adjusted EBITDA (4,053) 1,650 (8,722) 2,627 Pro forma impact on EBITDA (ix) — 429 — 1,527 Pro forma adjusted EBITDA $ (4,053) $ 2,079 $ (8,722) $ 4,154 Adjusted EBITDA $ (4,053) $ 1,650 $ (8,722) $ 2,627 Less: Capital expenditures (1,059) (748) (2,073) (1,324) Less / plus: Change in net working capital 5,342 (4,077) 4,581 (10,232) Free Cash Flow (1) $ 230 $ (3,175) $ (6, 214 ) $ (8,929) Adjusted EBITDA is defined as net income (loss) adjusted for interest expense (income) , income tax (benefit) expense, depreciation and amortization, impairment expense, acquisition deal costs, acquisition integration costs, acquisition earnout costs, purchase accounting fair value adjustment related to deferred revenue, severance costs, capital market and advisory fees, write - off of long - lived assets, equity - based compensation, committed equity facility transaction costs, and warrant liability fair value adjustments. Pro Forma Adjusted EBITDA is computed to give effect to the business combinations as if they occurred on January 1 of the year in which they were acquired. Free Cash Flow is computed as Adjusted EBITDA less capital expenditures and changes in net working capital. i. Redwire incurred acquisition costs including due diligence and integration costs. ii. Redwire incurred acquisition costs related to the Roccor and MIS contingent earnout payments and purchase accounting fair value adjustments to unwind deferred revenue for MIS and DPSS. iii. Redwire incurred severance costs related to separation agreements entered into with former employees, including, but not limited to, the Company’s former CFO. iv. Redwire incurred capital market and advisory fees related to advisors assisting with preparation for the Merger and transitional costs associated with becoming a public company. v. Redwire incurred expenses related to the Audit Committee investigation and securities litigation. vi. Redwire incurred expenses related to equity - based compensation under Redwire’s equity - based compensation plan. vii. Redwire incurred expenses related to the committed equity facility with B. Riley, which includes consideration paid to enter into the Purchase Agreement as well as changes in the fair value of the committed equity facility derivative asset. viii. Redwire adjusted the fair value of the private warrant liability with changes in fair value recognized as a gain or loss during the respective periods. ix. Pro forma impact represents the incremental results of a full period of operations assuming the entities acquired during the periods presented were acquired from January 1 of the year in which they occurred. For the three months ended June 30, 2021, the pro forma impact included the results of Techshot, while the six months ended June 30, 2021, included the results of Oakman, DPSS and Techshot. (1) On August 10, 2022, Redwire Corporation issued its earnings press release announcing its financial results for the second qua rte r ended June 30, 2022. Subsequently, the Company updated the amounts reported in the press release under Free Cash Flows, increasing the Company’s Free Cash Flow for the three and six months ended June 30, 202 2 from $(0.5) million and $(7.0) million to $0.2 million and $(6.2) million, respectively.